Credit Card Fraud Detection
Chenghao Ding, 12 April 2021
Credit Card Fraud Detection
Question: Identify the fraudulent credit card transactions from a huge imbalanced data?
It is important that credit card companies are able to recognize fraudulent credit card transactions so that customers are not charged for items that they did not purchase. Online shopping is on the rise as more of us stay at home and let our credit cards do the walking. Keeping pace with that trend is an unfortunate increase in credit card fraud. It’s no surprise that online fraud has been a growing problem for the past few years. And now, as consumers and businesses adapt to the worldwide pandemic and make more credit card transactions in the card-not-present (CNP) space, the resulting uptick in online shopping and ecommerce has opened up an even bigger playground for fraudsters to try out new tricks.
Data Description
The dataset contains transactions made by credit cards in September 2013 by European cardholders. This dataset presents transactions that occurred in two days, where we have 492 frauds out of 284,807 transactions. The dataset is highly unbalanced, the positive class (frauds) account for 0.172% of all transactions.
There are in total 28 features are found after using PCA transformation, however, due to privacy issues, the real backgroud information is hided.
Among those 28 features, ‘time’ and ‘Amount’ are the most significant two. Feature ‘Time’ contains the seconds elapsed between each transaction and the first transaction in the dataset. The feature ‘Amount’ is the transaction Amount, this feature can be used for example-dependant cost-sensitive learning. Feature ‘Class’ is the response variable and it takes value 1 in case of fraud and 0 otherwise.
The whole project can be found in my GitHub: (CreditCardFraudDetection).
Objective
- Find the how is the imbalanced data skewed and how to make them 'balanced' in terms of having a similar amount of "Fraud" and "Non-Fraud" transactions.
- Find a Classifiers that has a higher accuracy of identifying "Fraud" transactions.</a>
- Create a Neural Network and compare the accuracy to our best classifier.
Data Analysis
1. Understanding our data
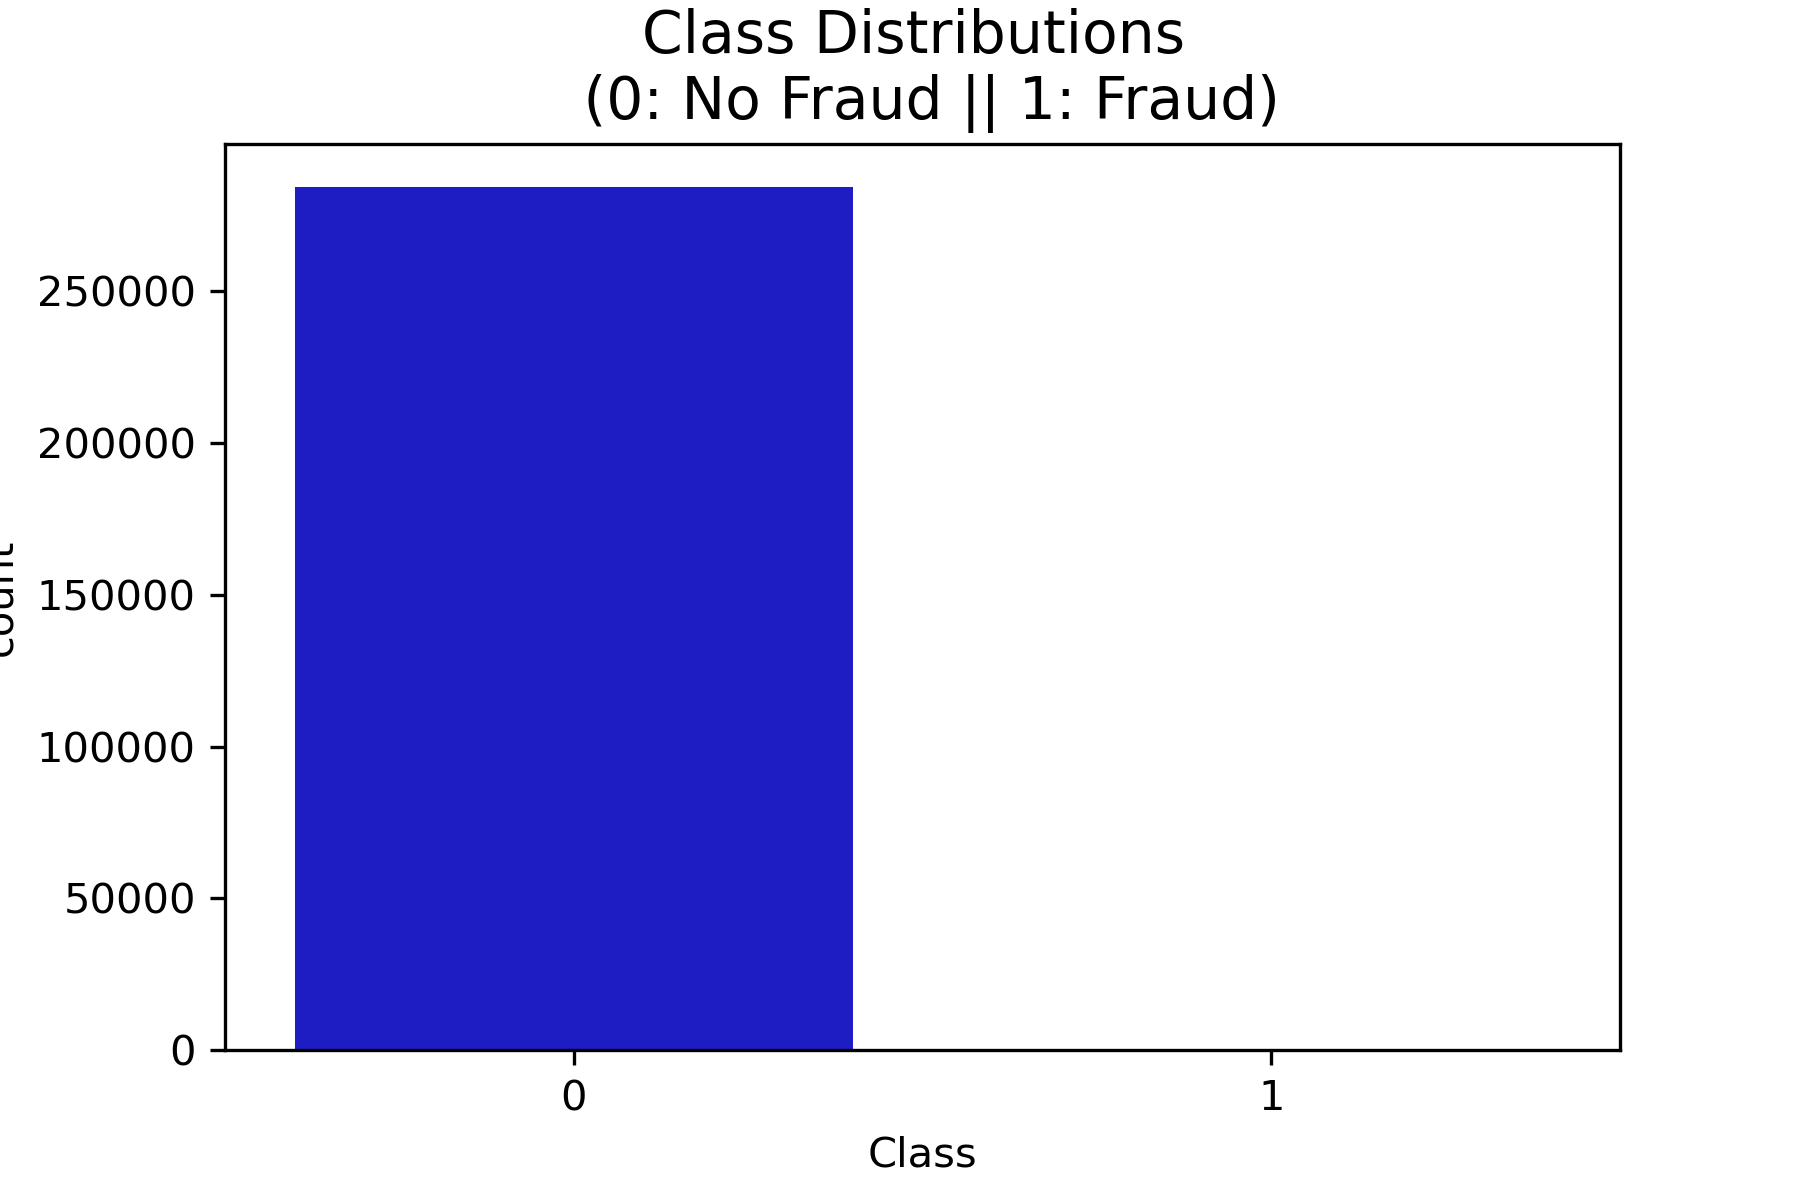
On one hand, this figure shows that almost all of transaction records are non-fraud, while only 0.17% are actually fraudulent. On the other hand, the transaction amount is also significantly imbalanced with most of the amount very small. In fact, the mean of all the mounts made is approximately USD 88.
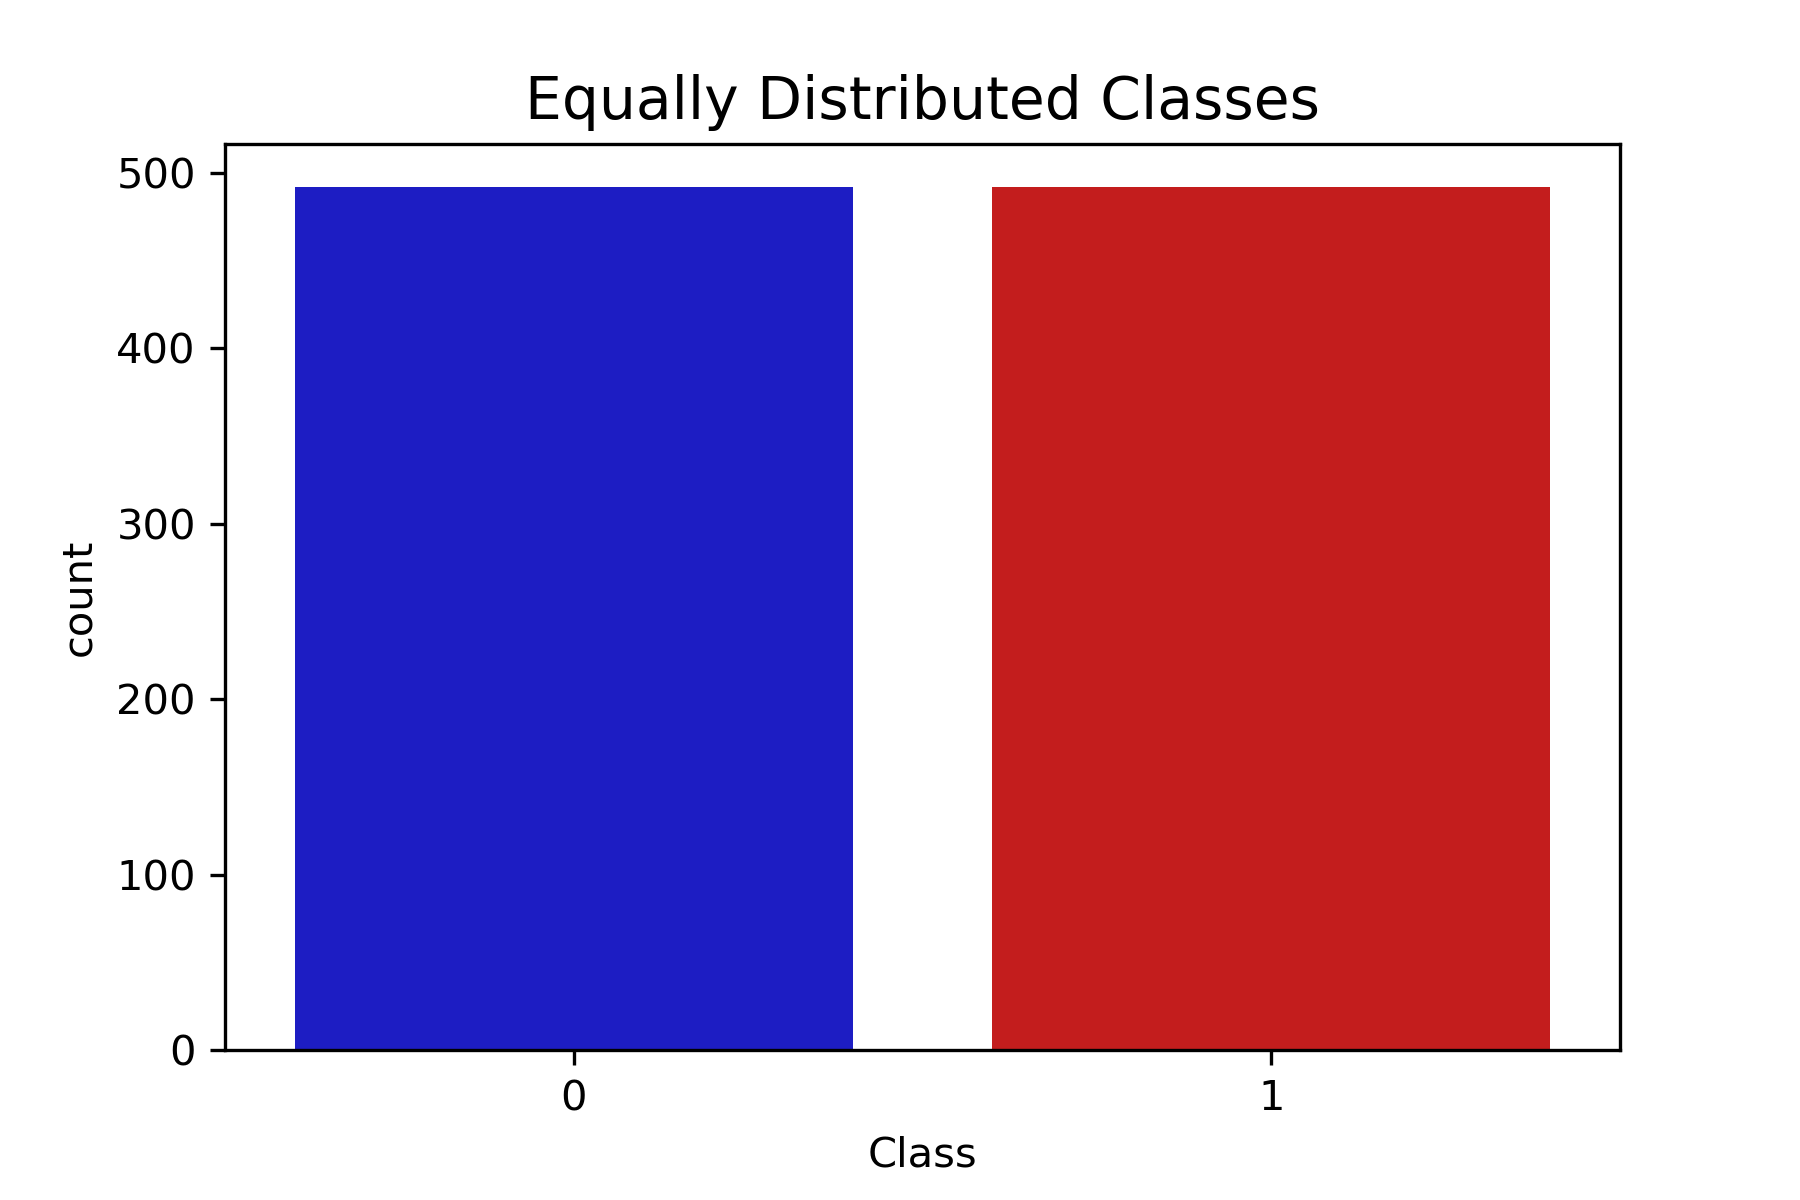
2. Preparing dataset
Before make a sub-sample of datasets, split the datasets into train data(80%) and test data(20%). Then, random under sampling technique is used to create a more balanced dataset and thus avoiding our models to overfitting. In more details, a 50/50 ratio subset is created with 492 cases of fraud and 492 cases of non-fraud transactions.
3. Observe Correlation of Features
It is important to know if there is any feature have very clear positive or negative correlations with our classification.
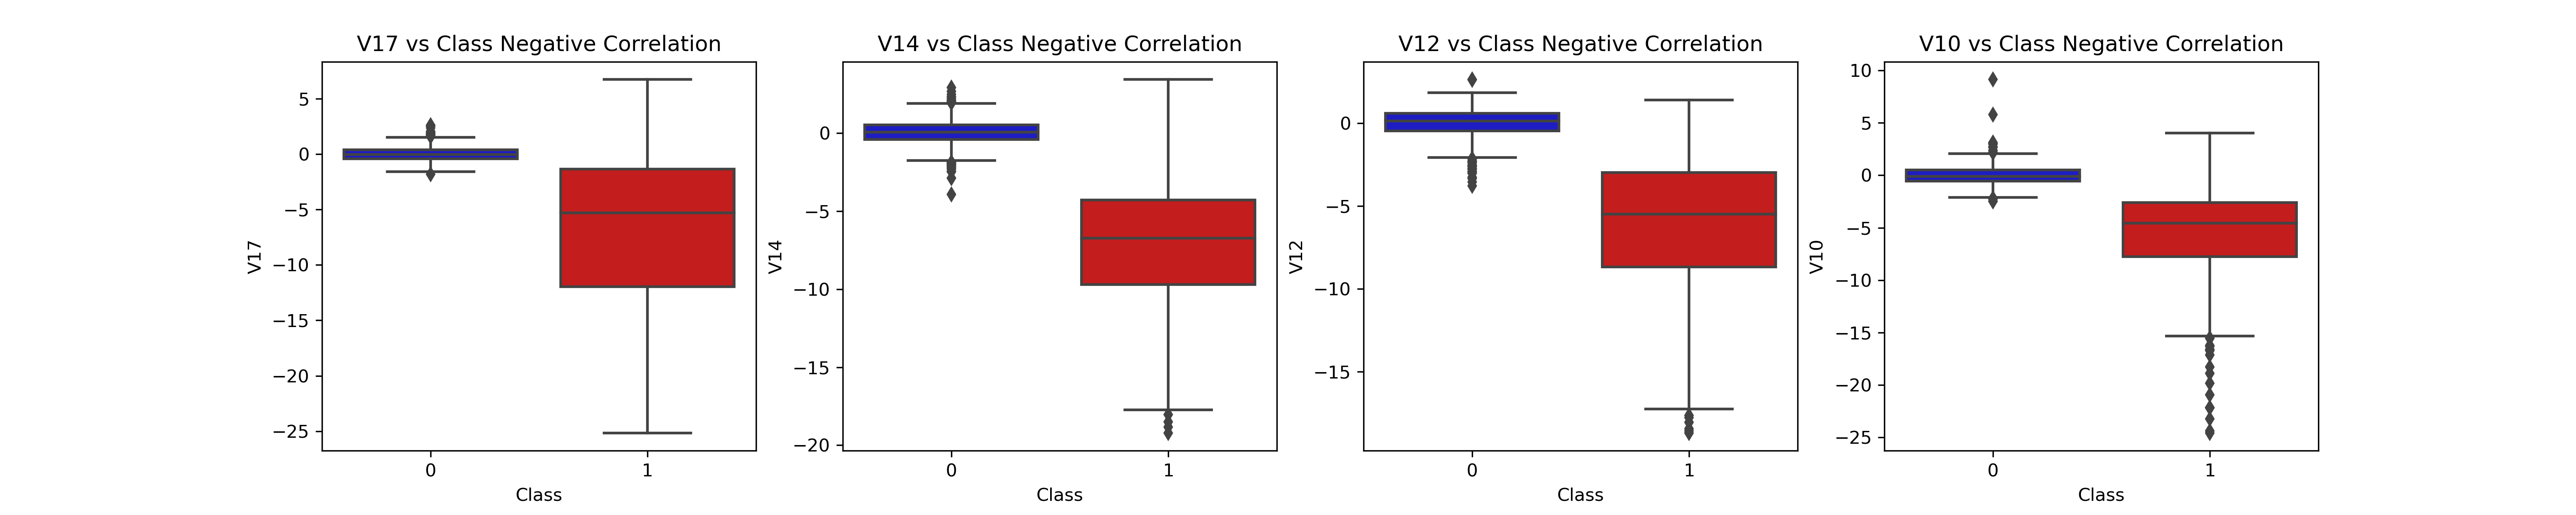
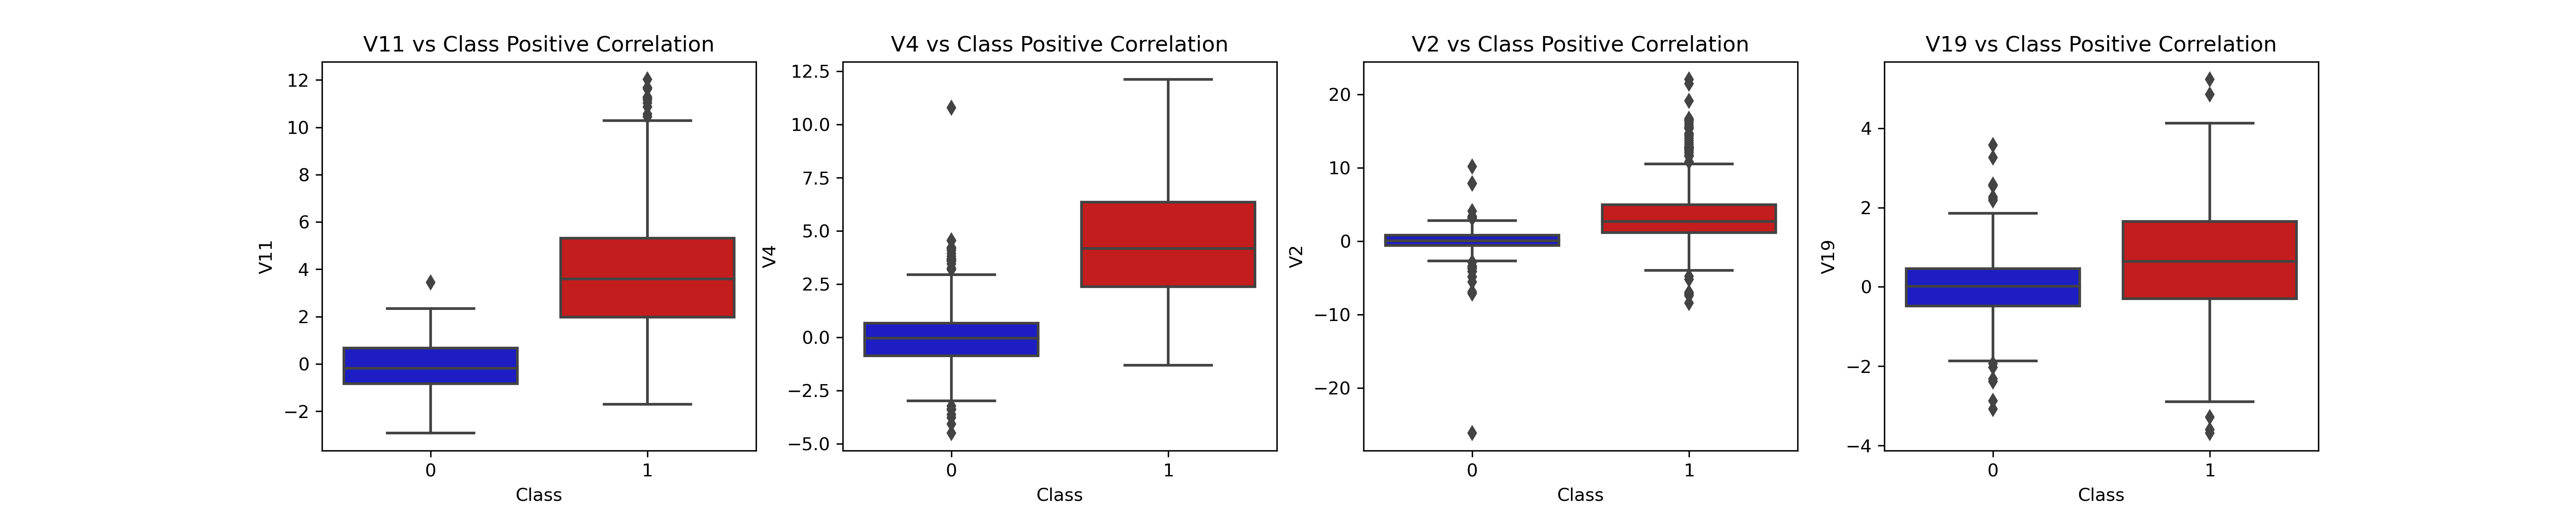
We find that V17, V14, V12 and V10 are negatively correlated. Notice how the lower these values are, the more likely the end result will be a fraud transaction. Positive Correlations: V2, V4, V11, and V19 are positively correlated. Notice how the higher these values are, the more likely the end result will be a fraud transaction.
However, we also find that some of the features like V10 has a lot of outliers observed in the box plots. Thus, this might suggest that remove those outliers to avoid mess up.
4. Anomaly Detection
To remove “extreme outliers” from features that have a high correlation with our classes, interquartile Range Method (IQR) is used.
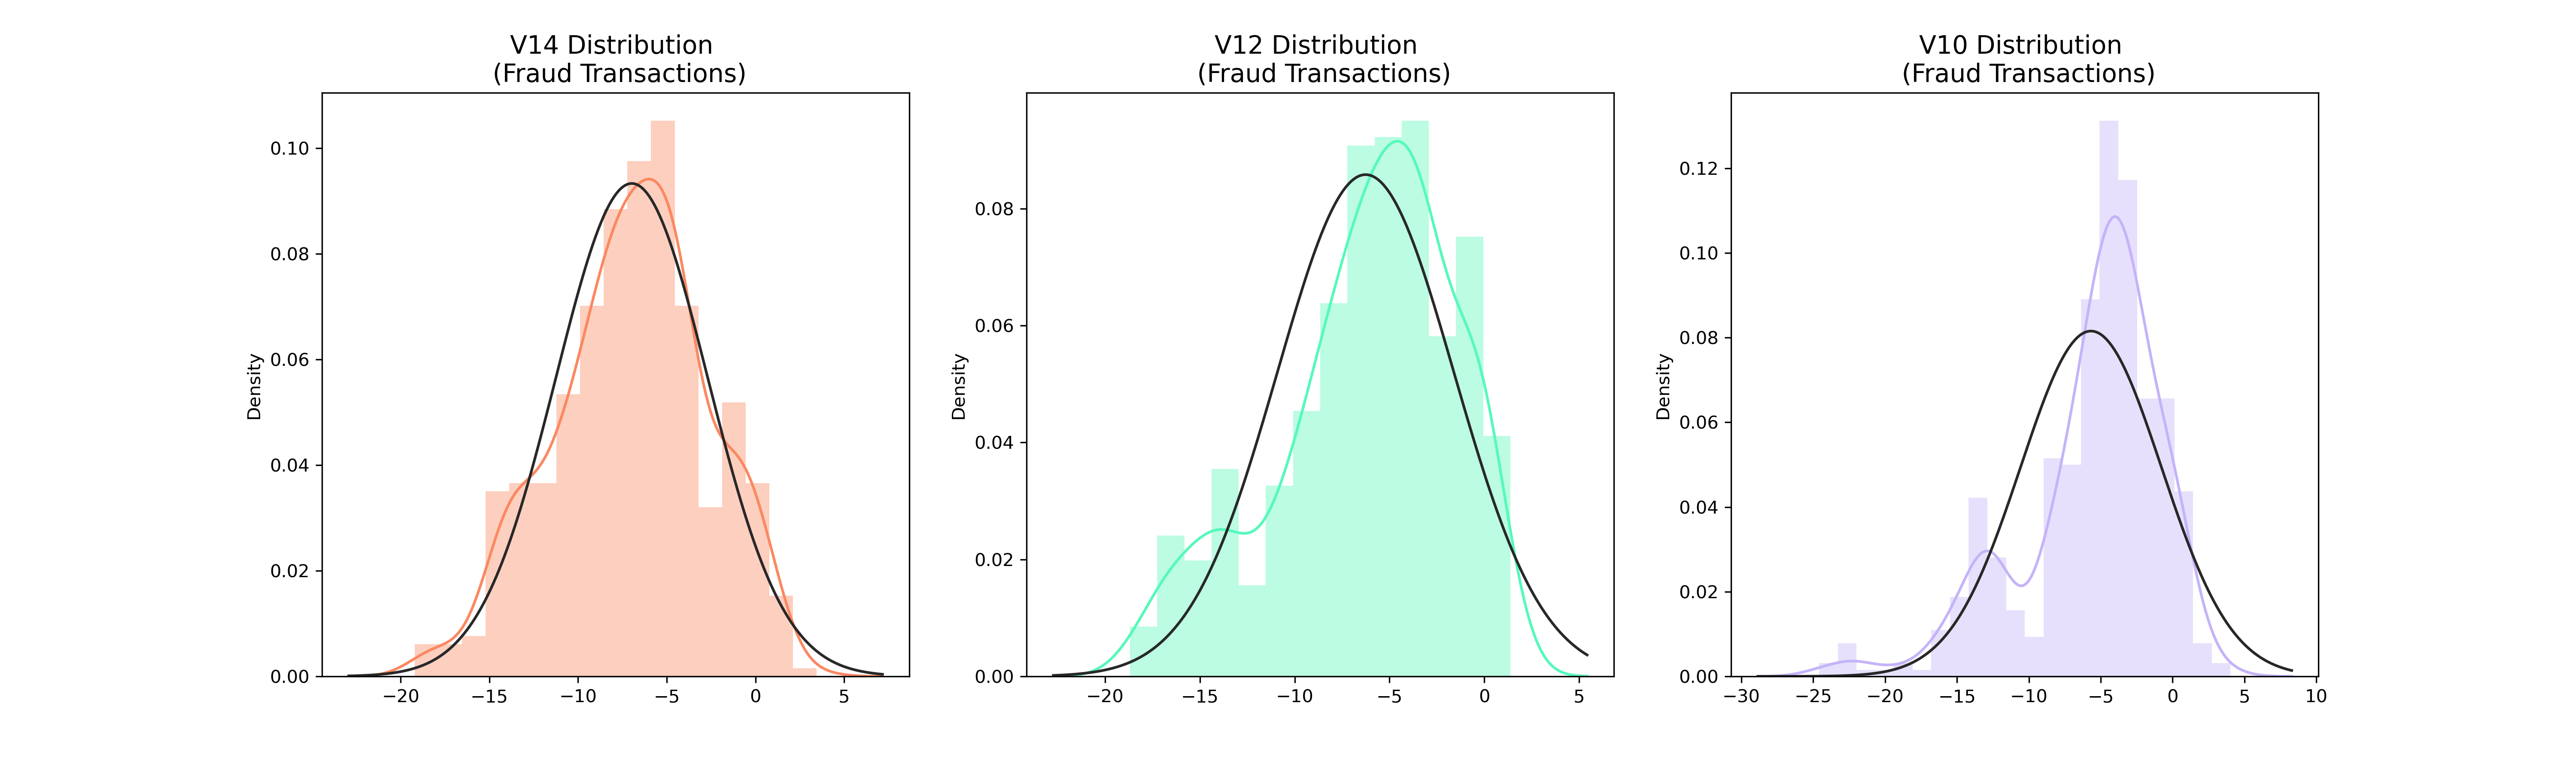
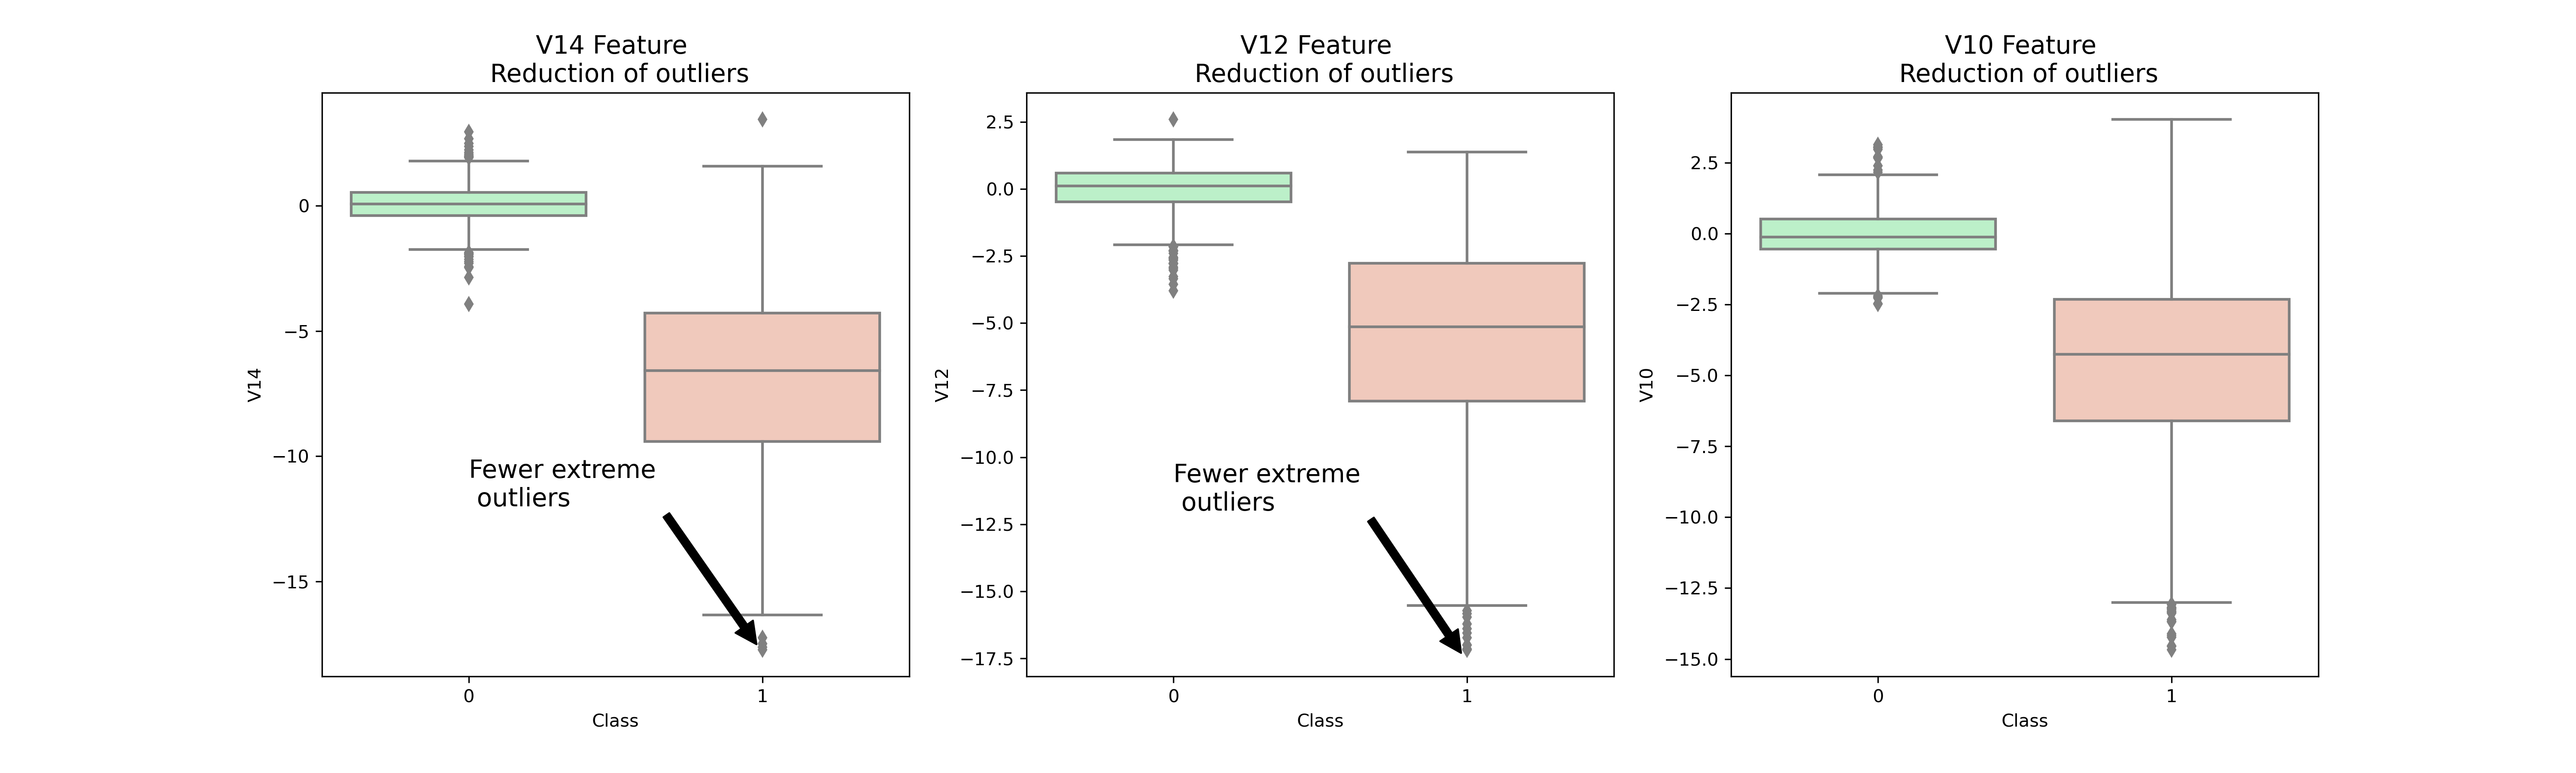
From the plot, V10, V12, V14 outliers are reduced significantly. This will alleviate the distortions of distribution made by those outliers and make a better fit.
5. Dimensionality Reduction and Clustering
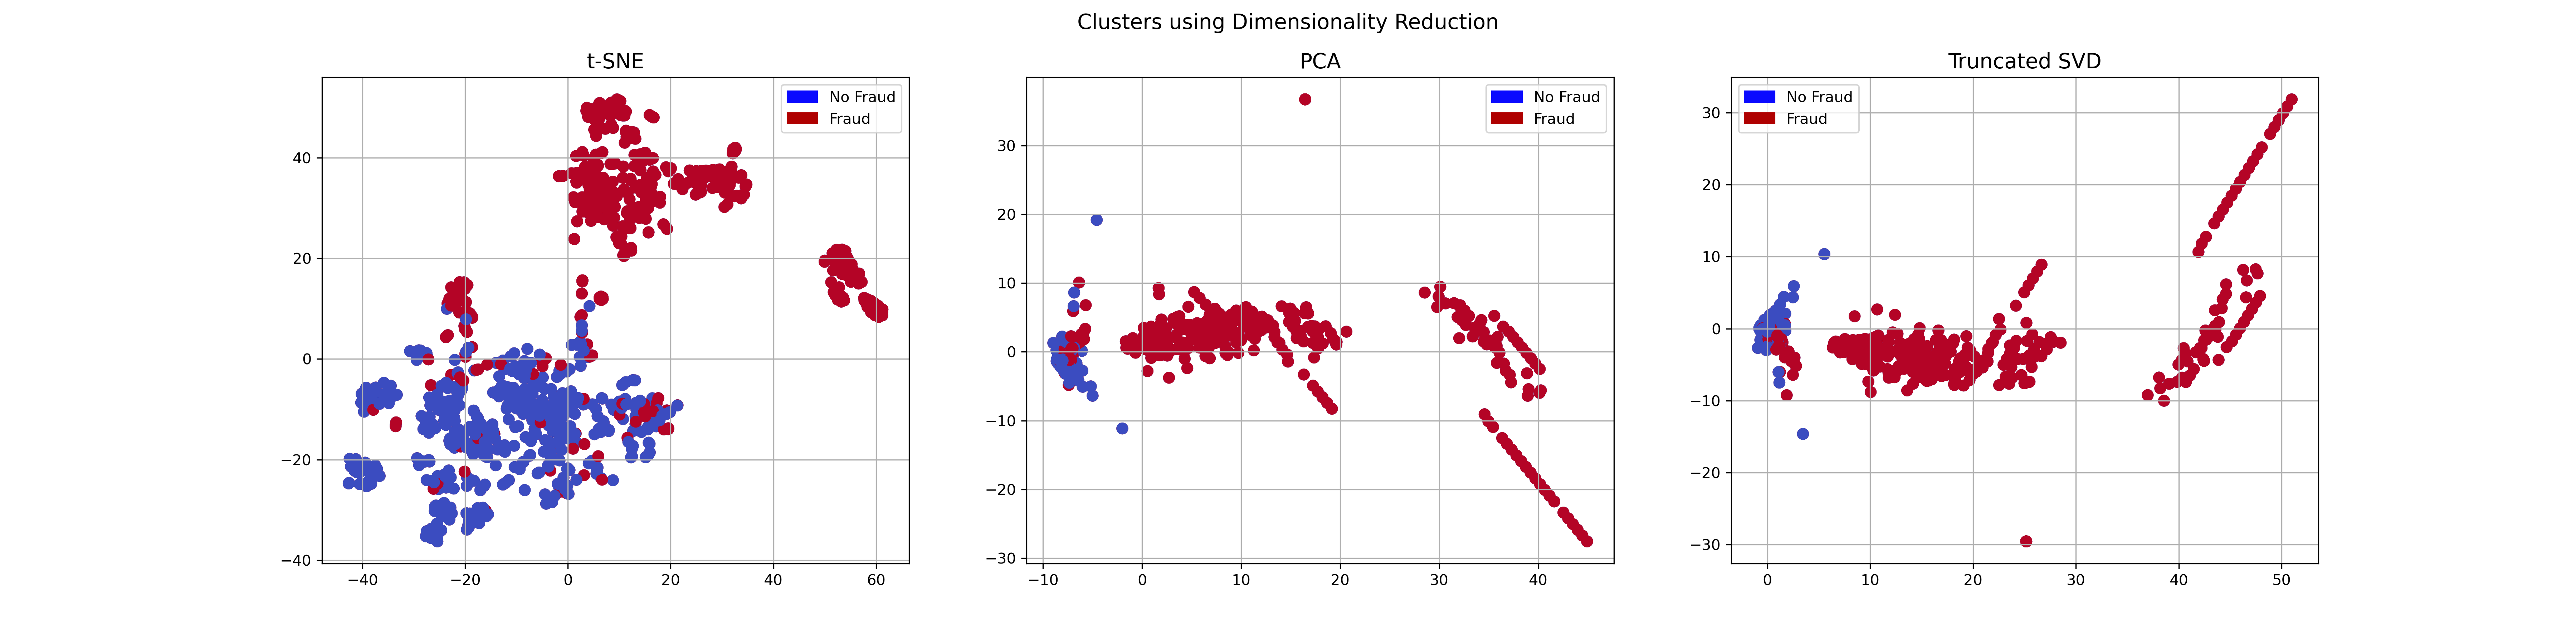
The t-SNE is compared with another two different clustering methods, i.e. PCA and Truncated SVD. We find that t-SNE can do a very good job in identifying the non-fraud versus fraud.
Classifiers (UnderSampling & OverSampling) and Model Training
In order to find a best classifier to identify fraud credit card detections. Four classifiers such as Logistic Regression, K-Nearset Neighbors, Support Vector, and Decision Tree are used.
To avoid data leakage problem, under sample has to be implemented during cross validating. Otherwise, it is very likely that the trained model will be overfitted. This will prevent the test data being polluted from outside information of training data.
Therefore, Near-Miss algorithm is used during cross validation to see how it distributes the labels if we don’t use these variables.
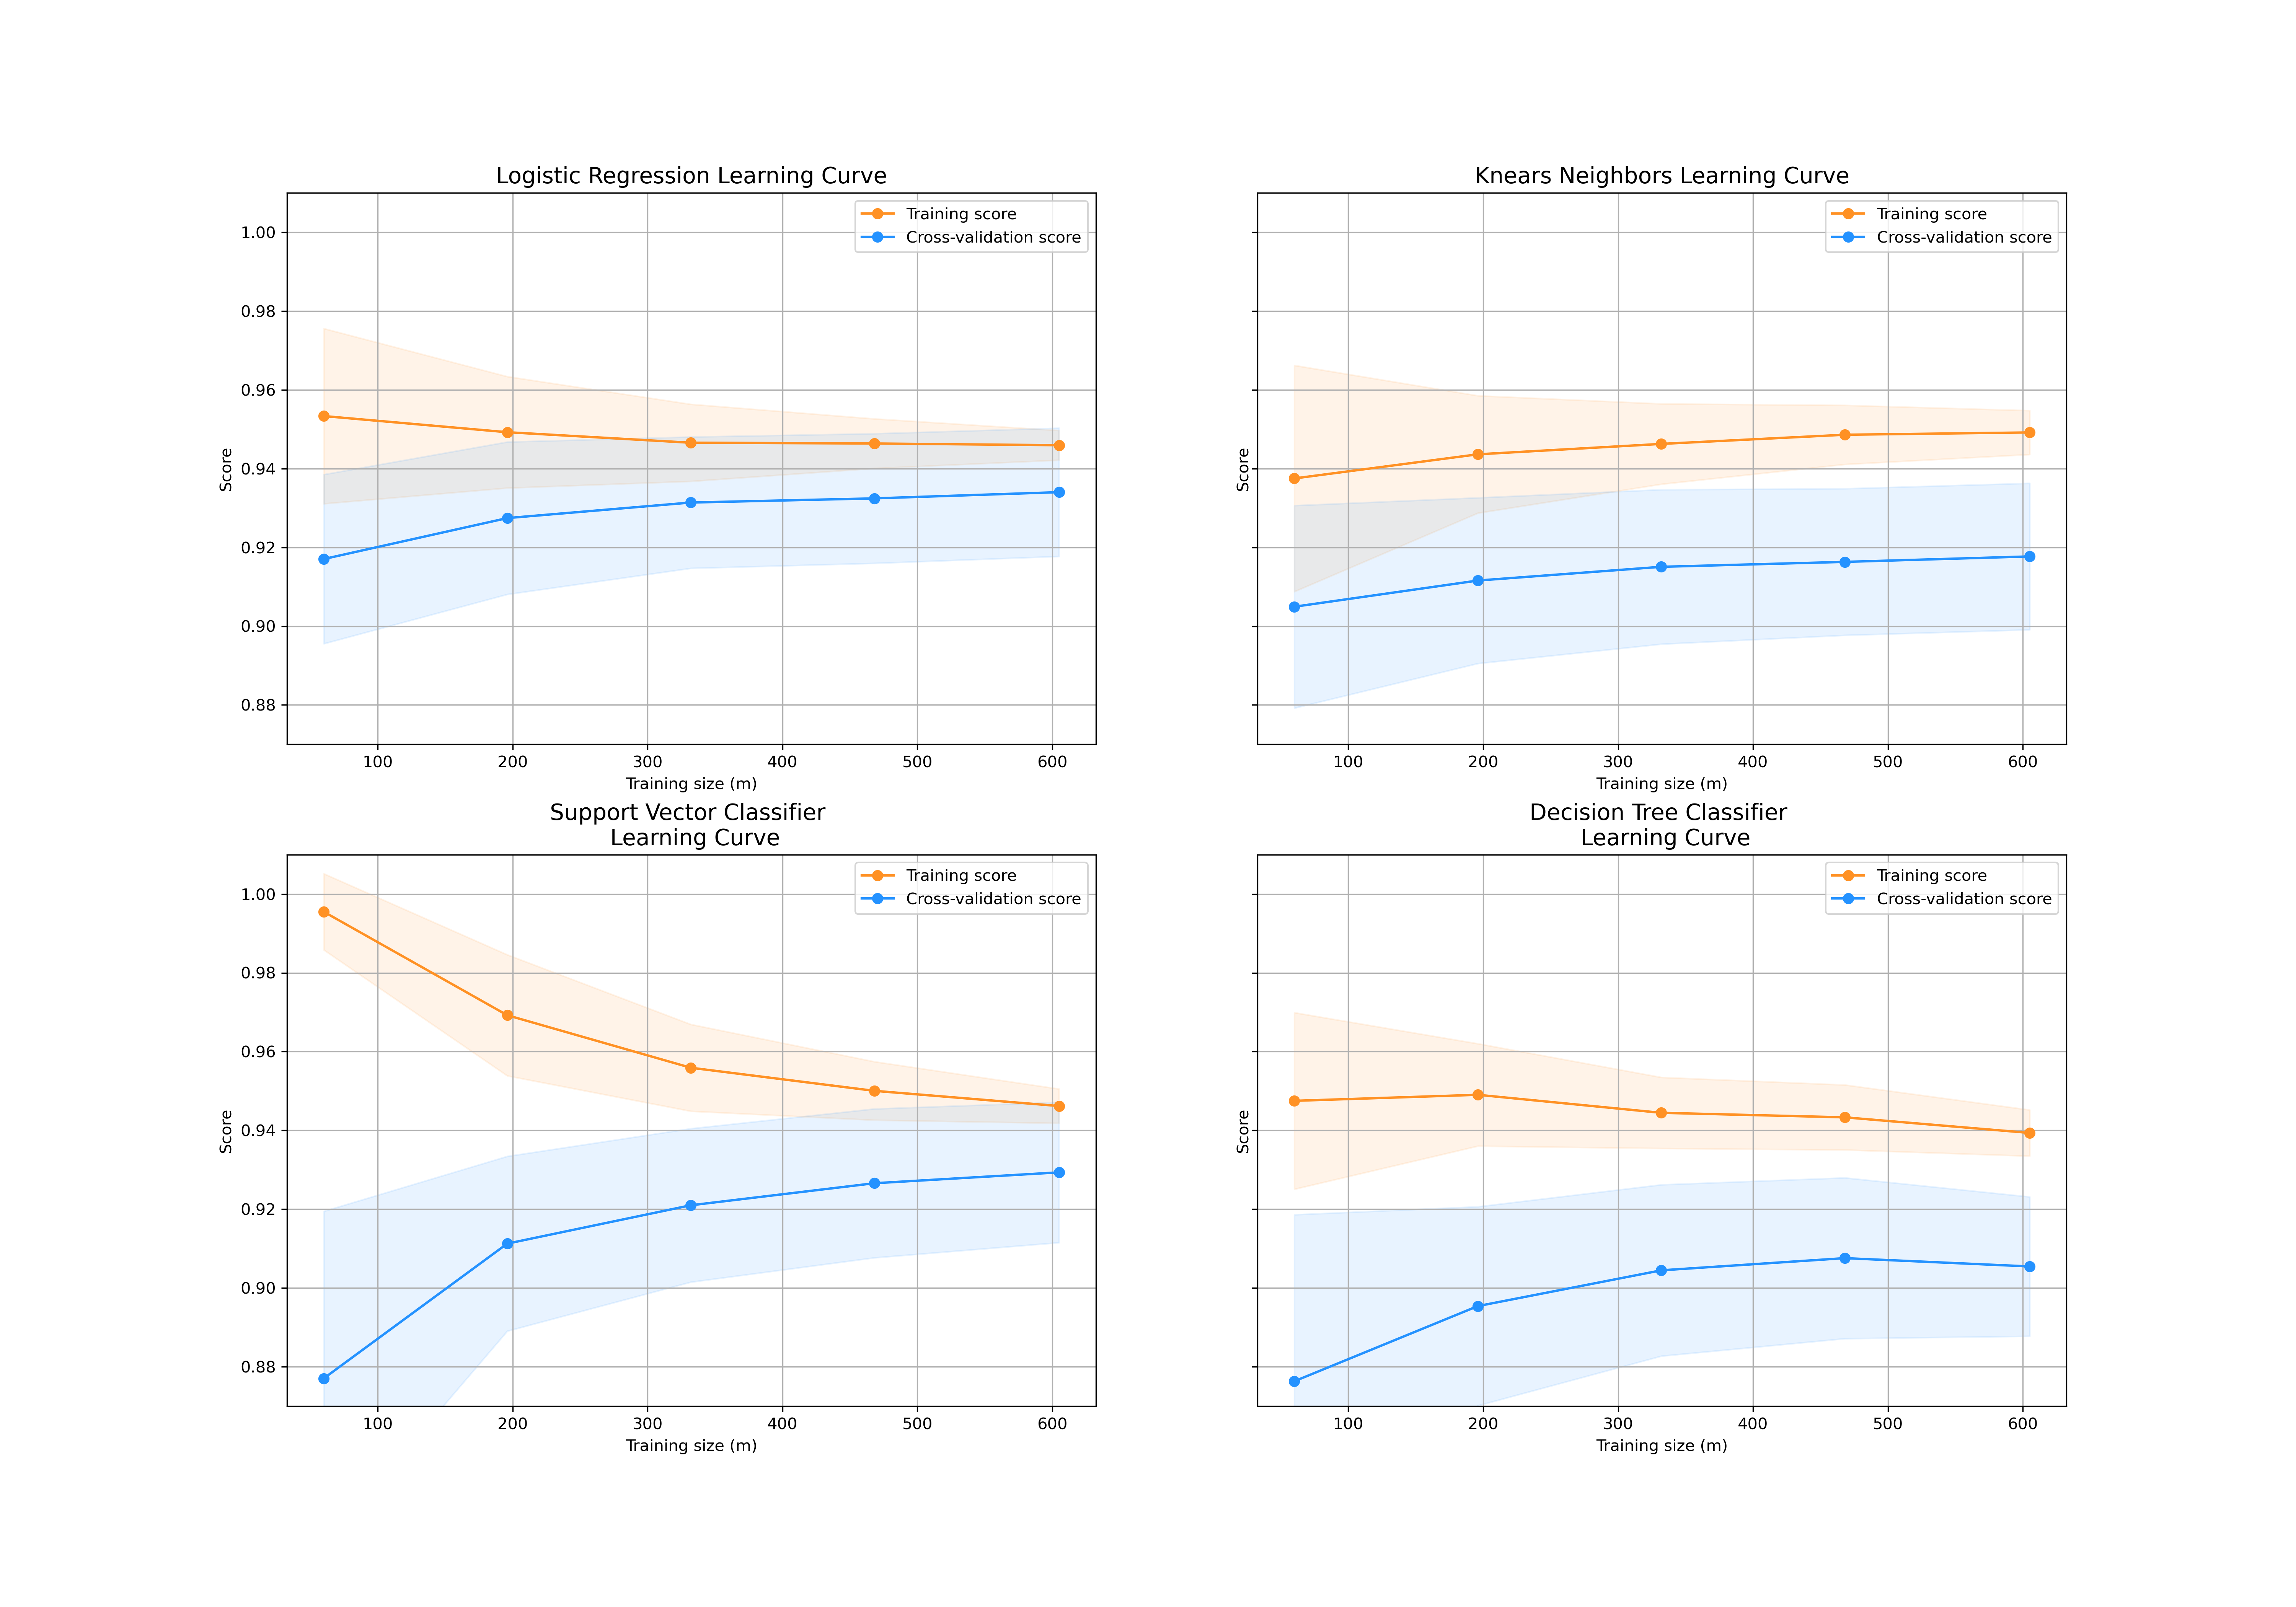
For the training dataset, Logistic regression gets the highest accuracy score of 95.4%, and decision tree is the worst. Then, the trained model has been applied to validation data, and apparently the validation score keeps growing. This suggests that an overfitting issue is resolved.
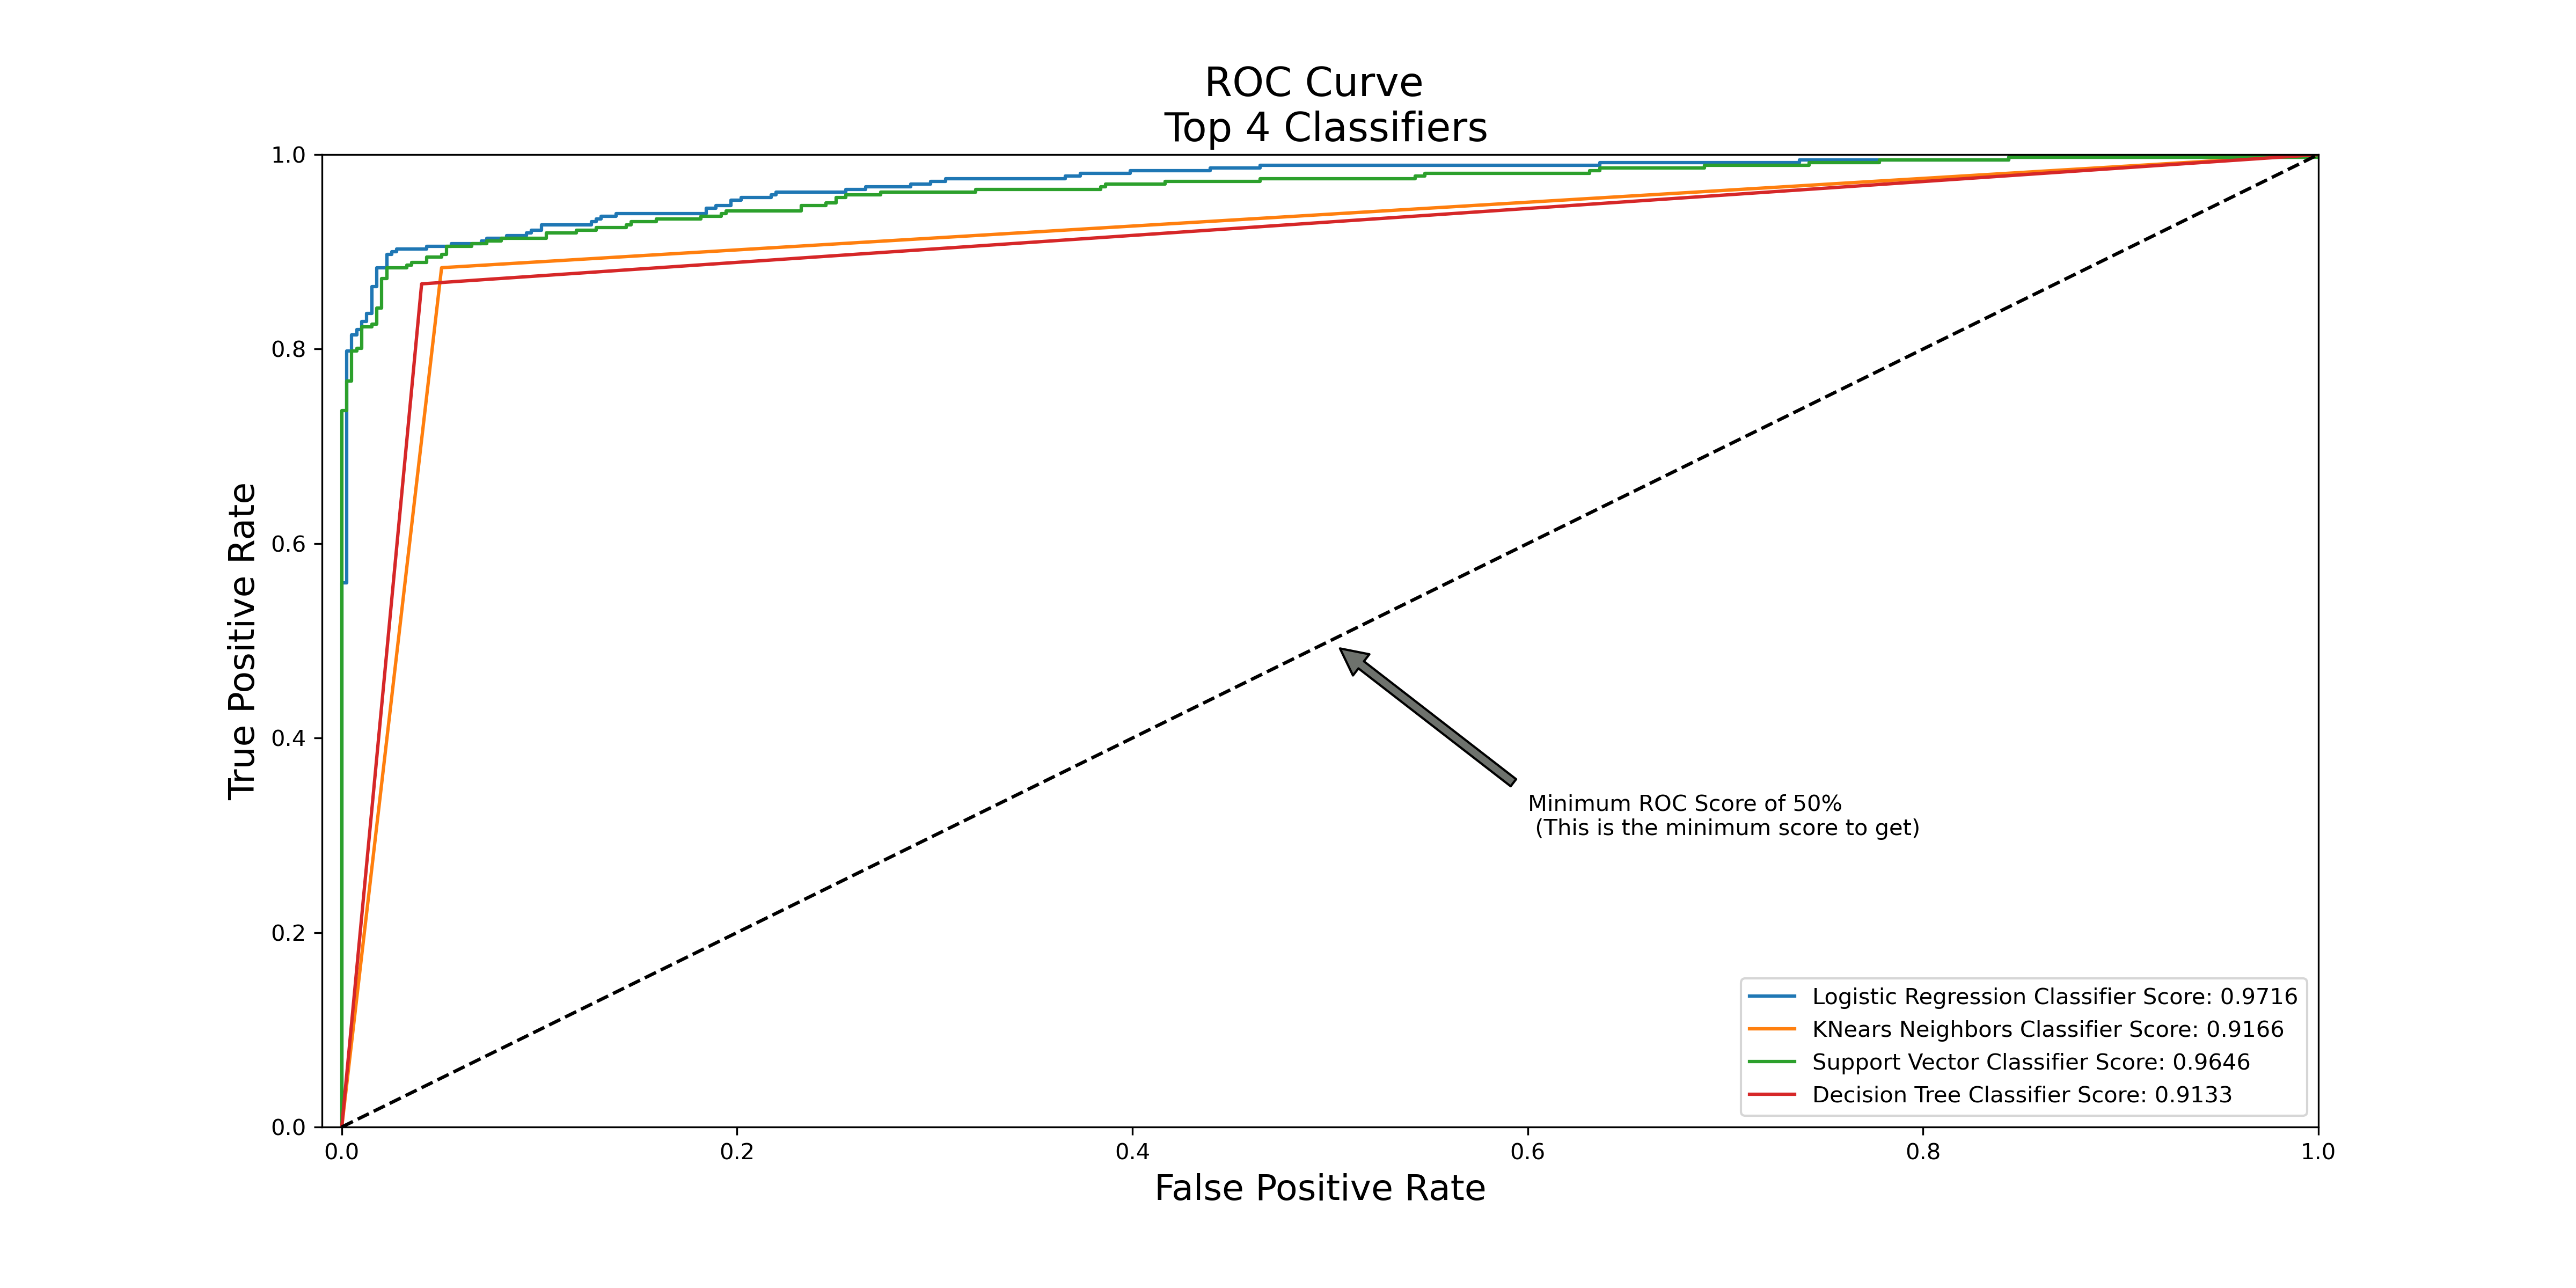
This figure shows the ROC score of four different classifiers we used. Among the four classifiers, logistic regression has the best accuracy score of 0.9792.
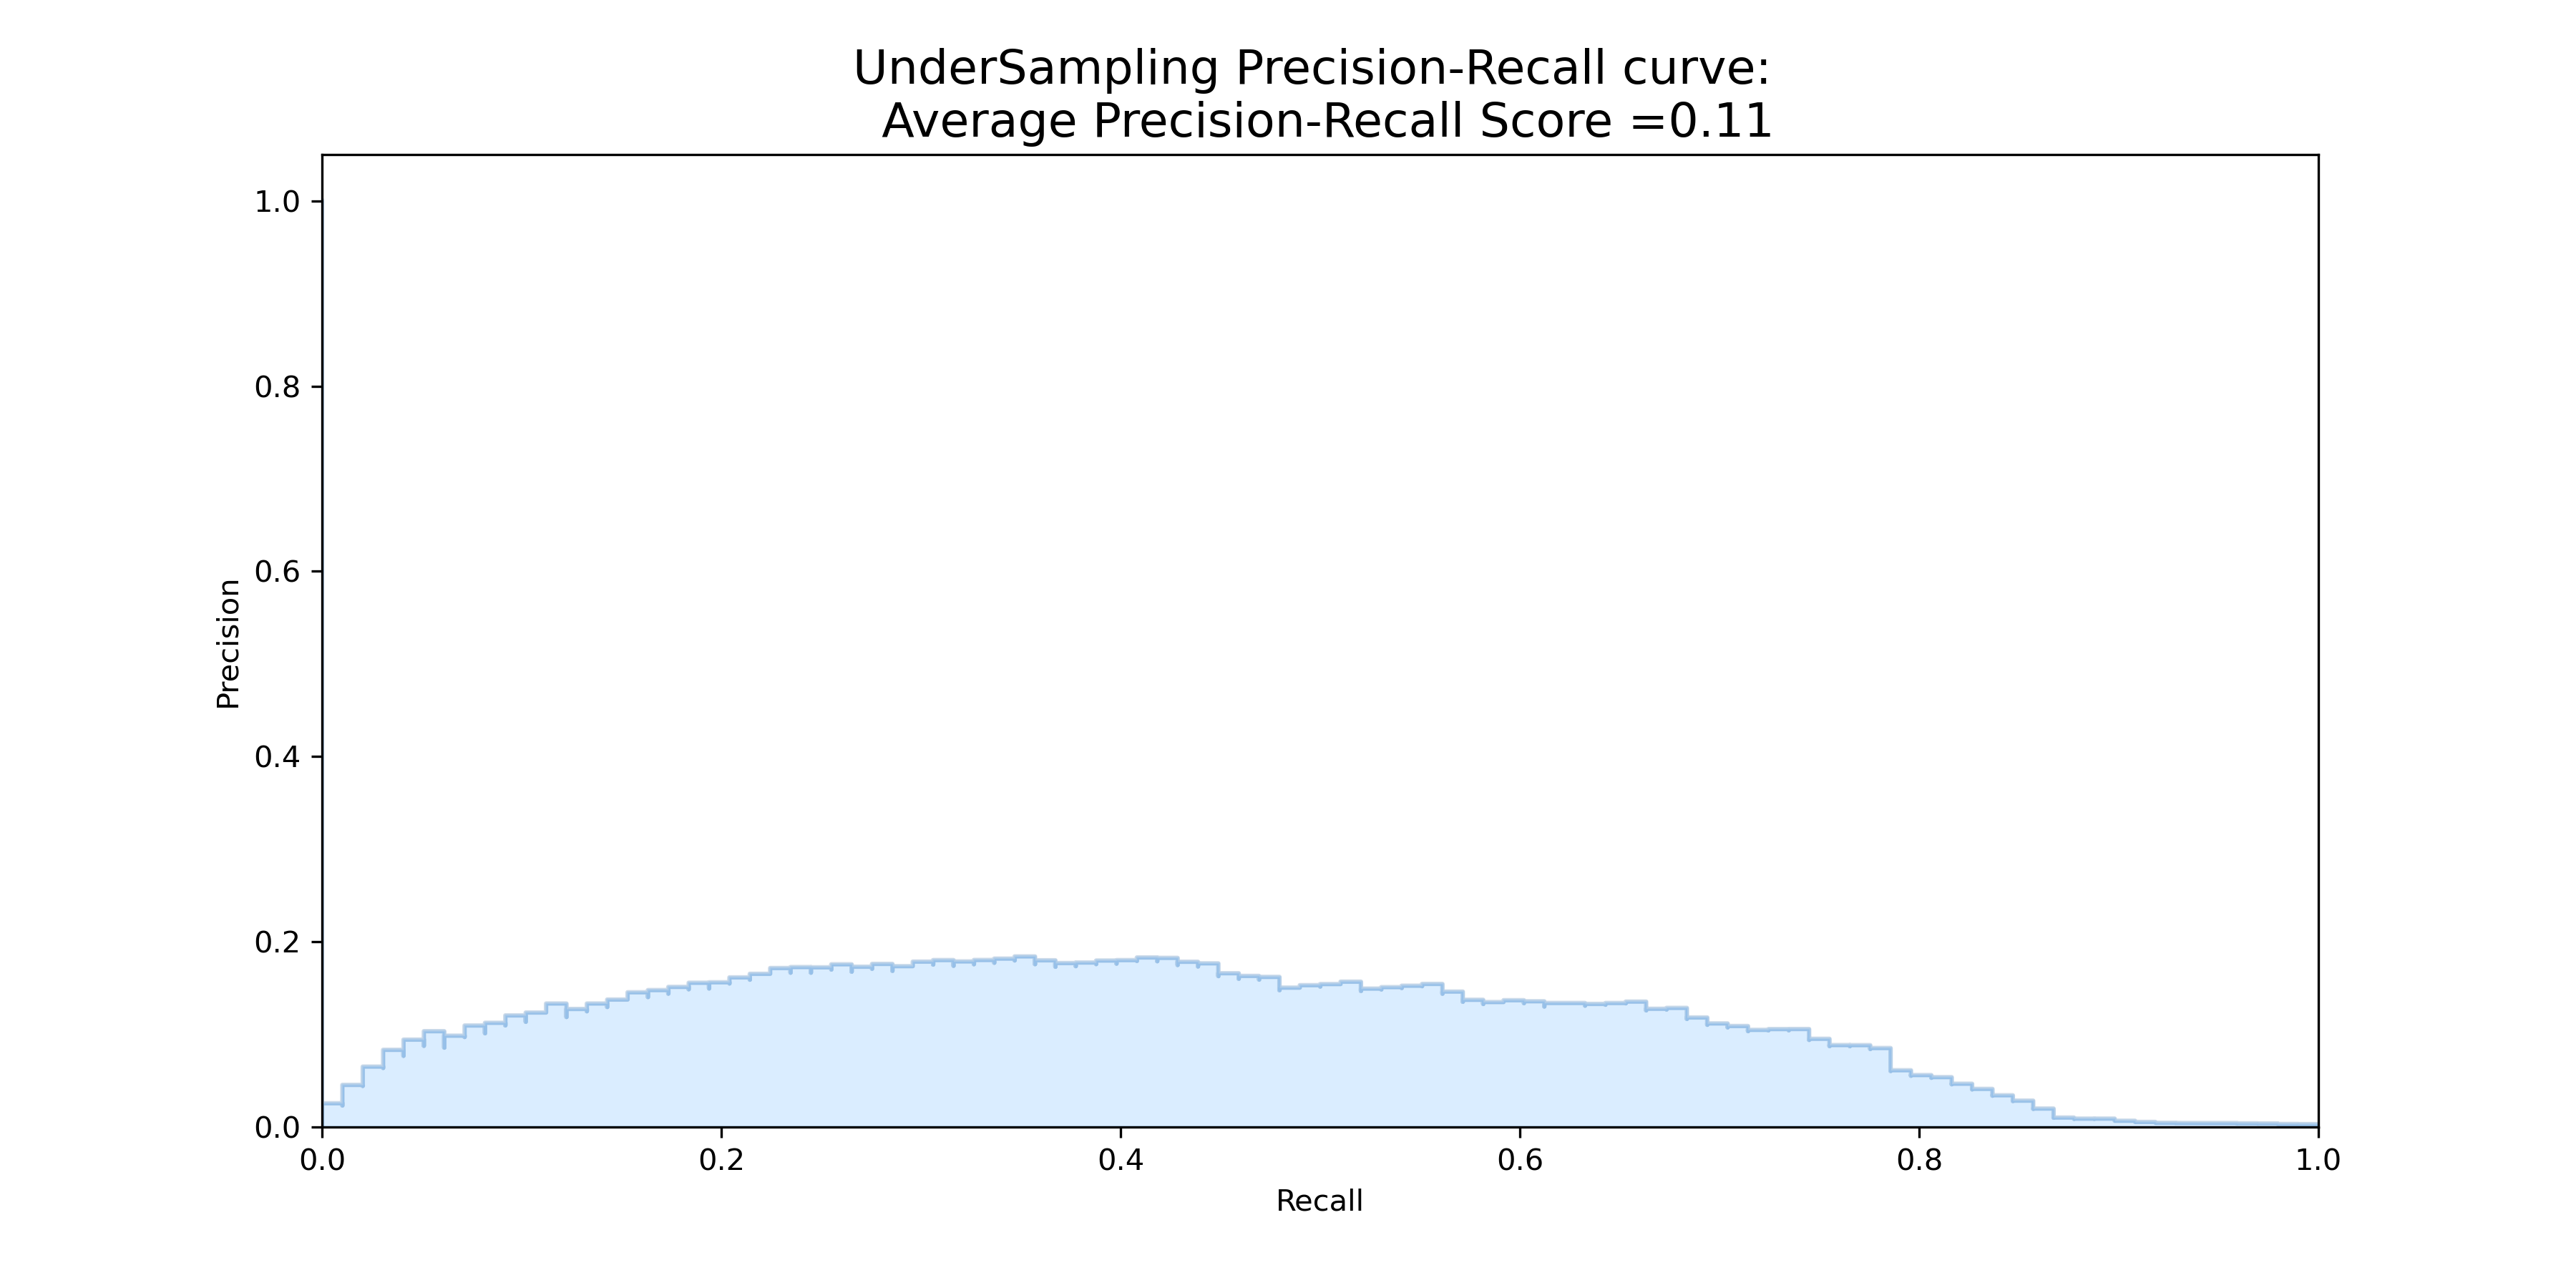
However, we find that under sampling Average Precision-Recall Score on the original test set is 0.11. This means that the logistic can do a very good job in classification, but we do not necessarily did very well in identifying fraud transactions (positive class) even if we get a high score.
Next step, I am going to try the Over-Sampling method as known as SMOTE technique. SMOTE creates synthetic points from the minority class in order to reach an equal balance between the minority and majority class. SMOTE picks the distance between the closest neighbors of the minority class, in between these distances it creates synthetic points.
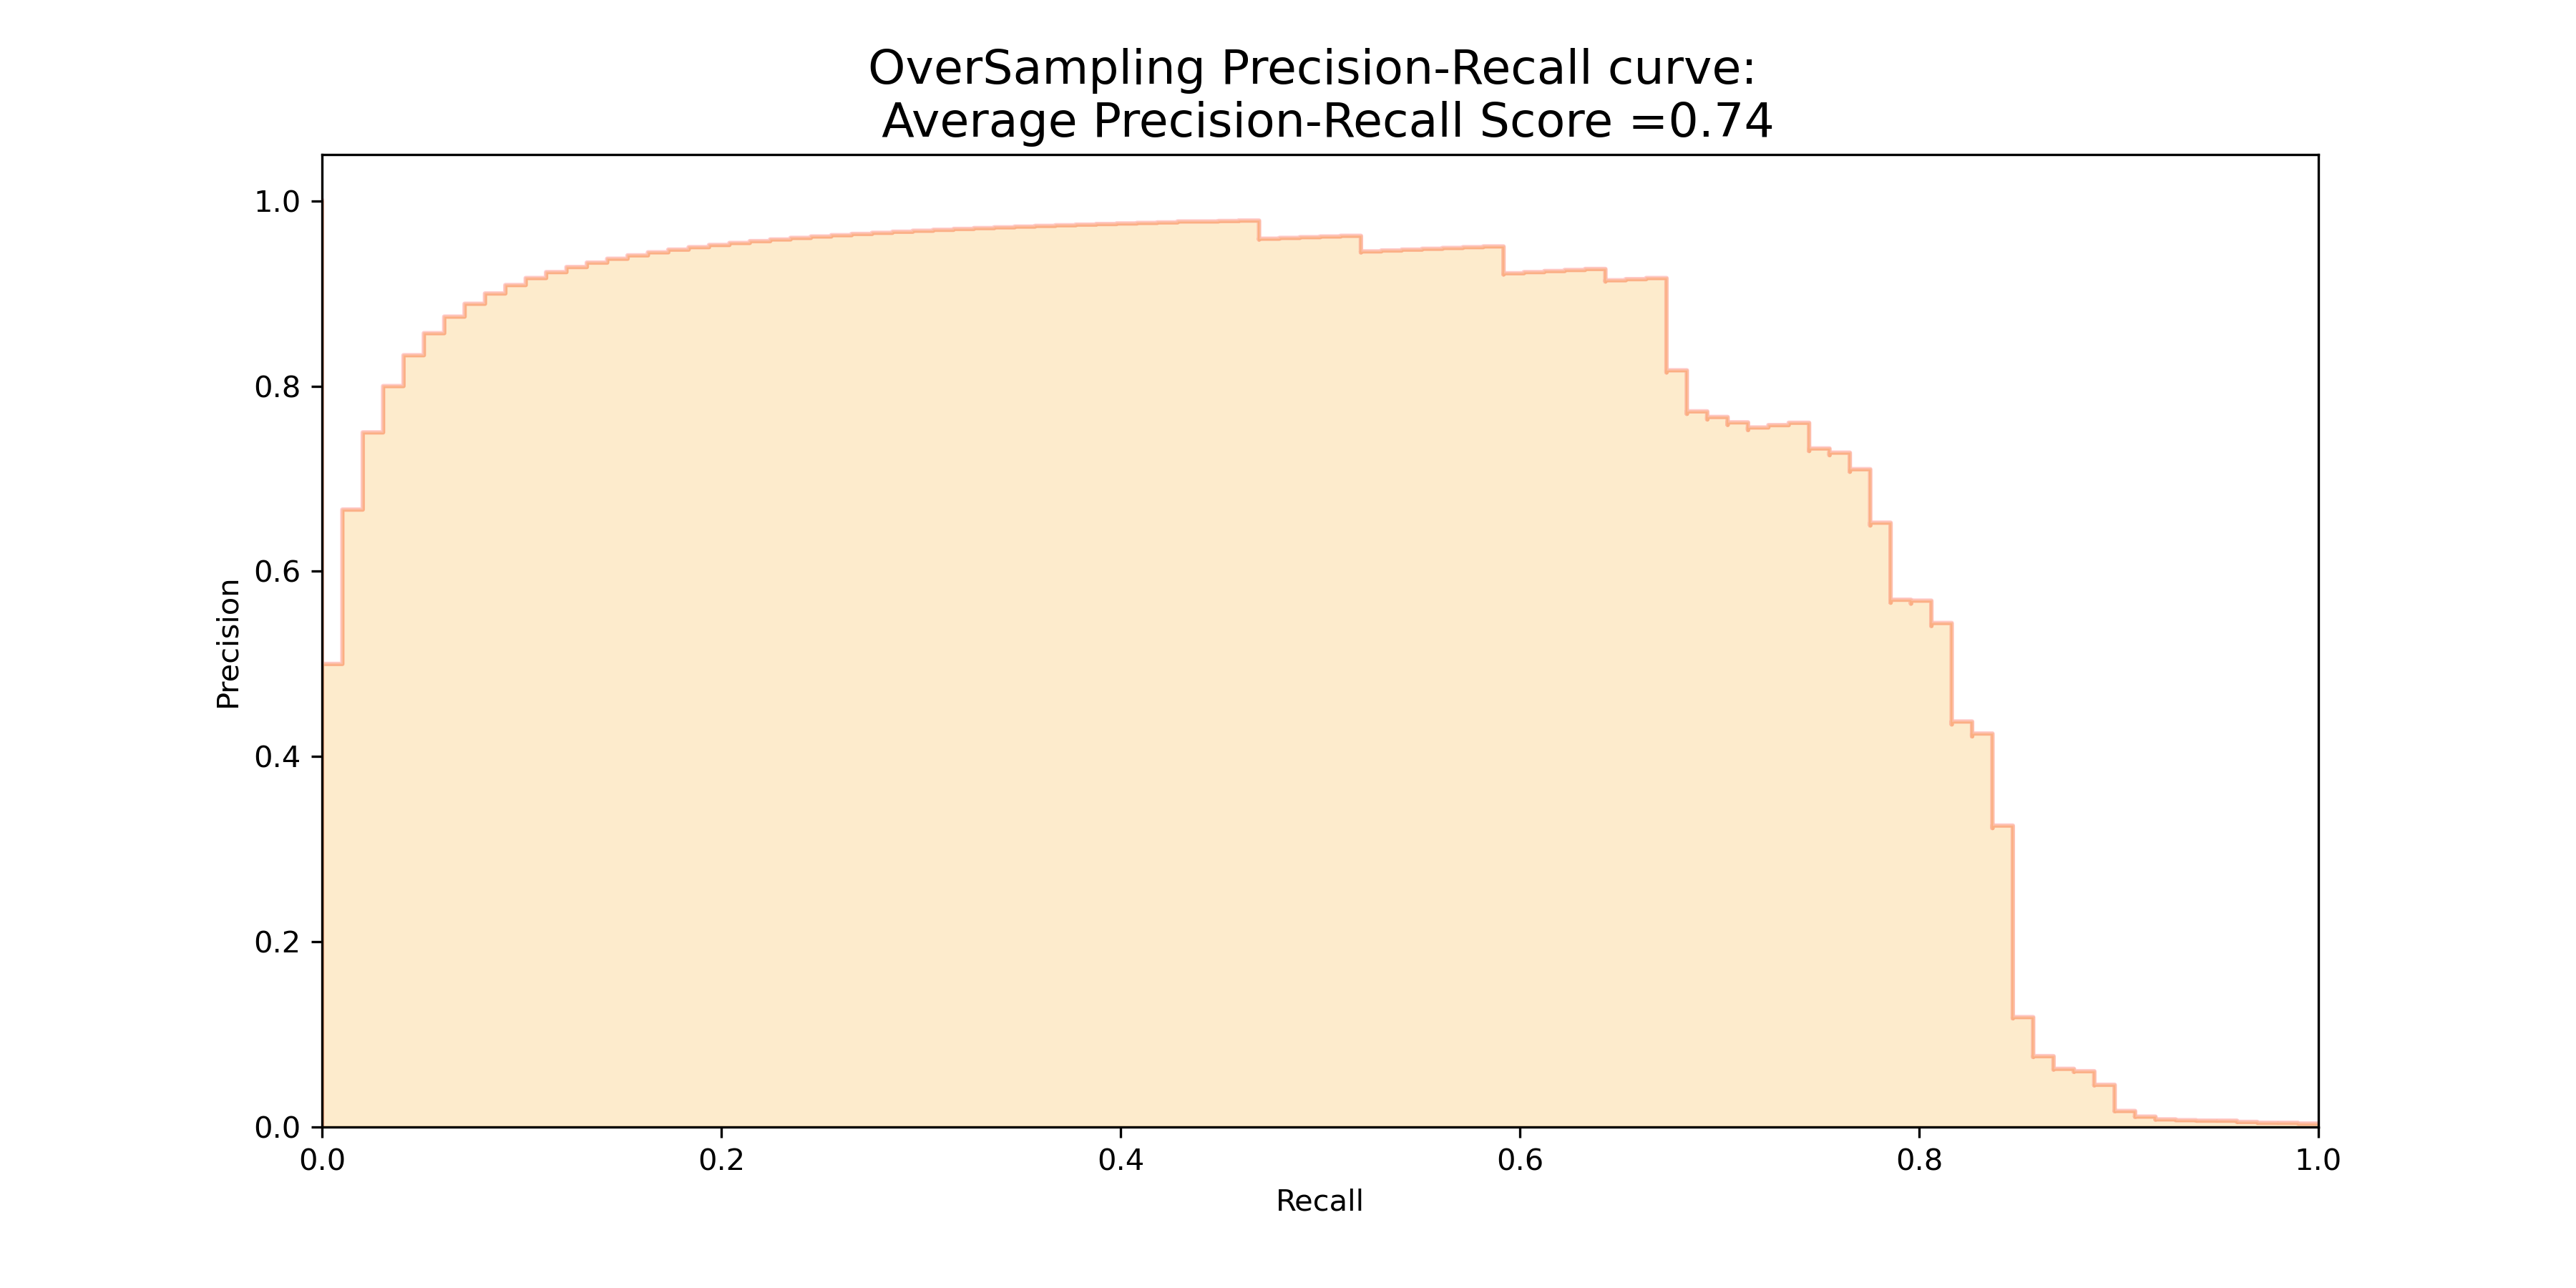
From this figure, we find that the over sampling method indeed gets a much higher average precision recall score of 0.74 on the original test set, although it takes longer to train model because we are not removing any majority class information while instead add more minority class to balance the data.
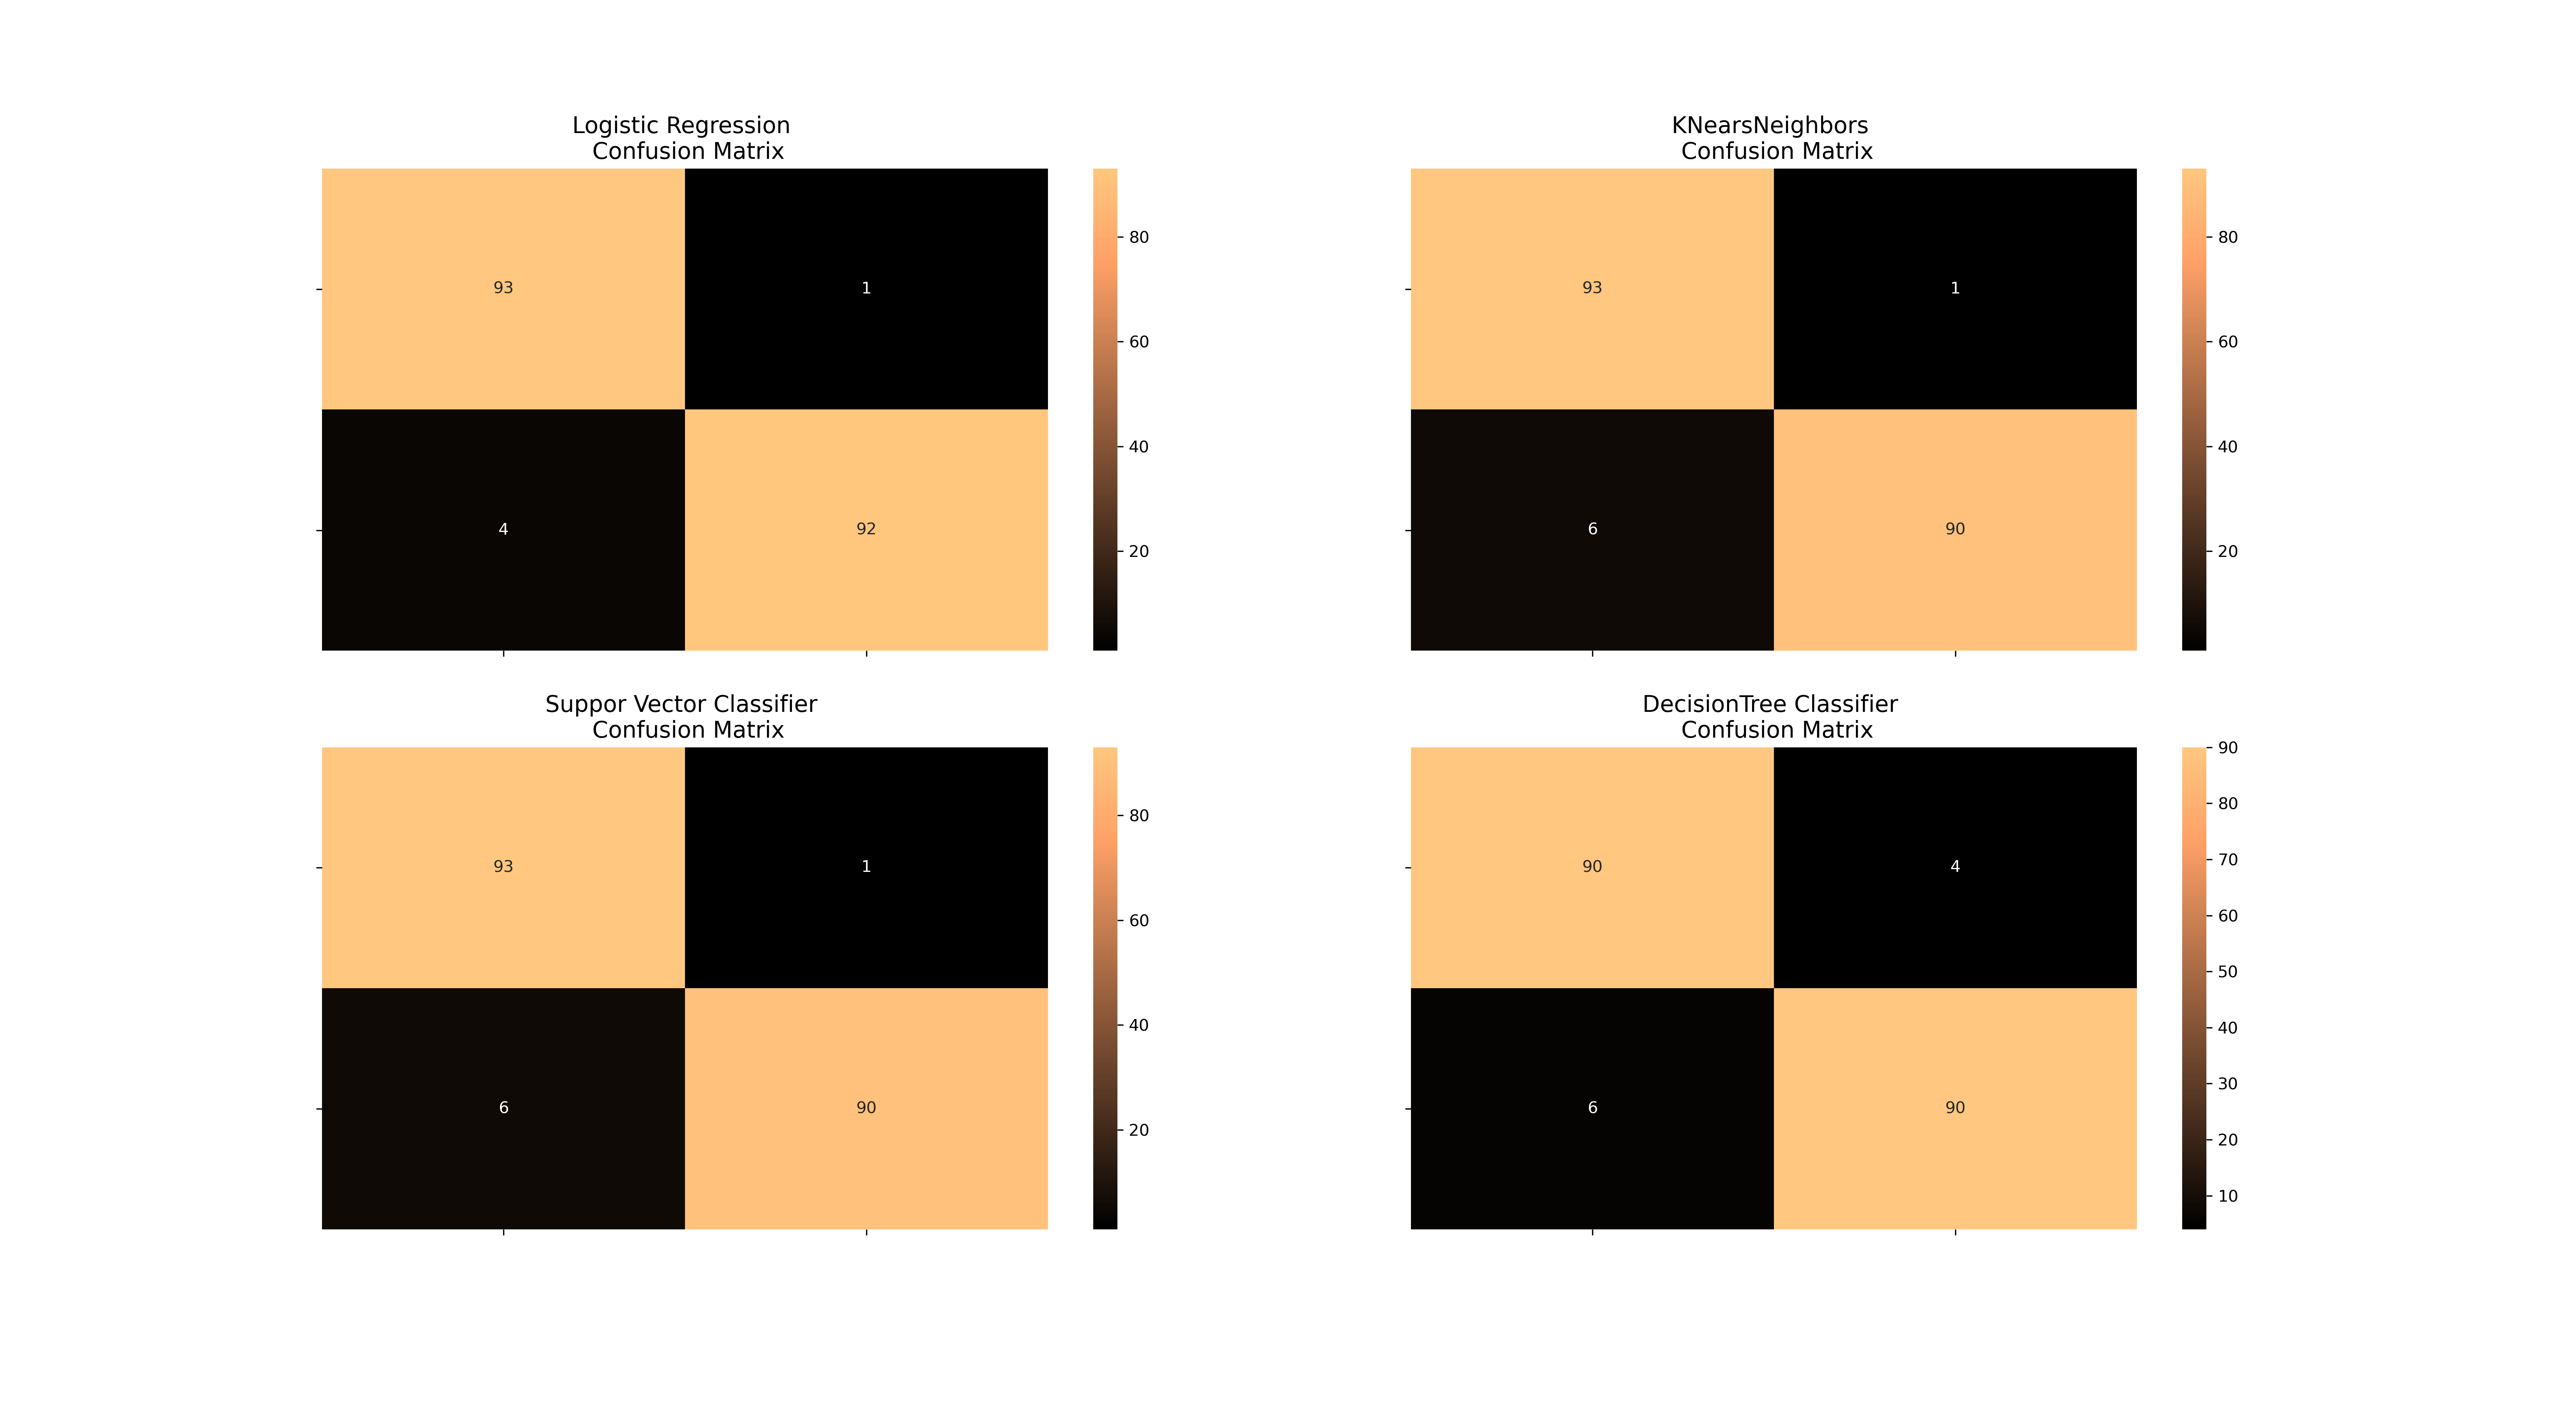
Here, there are four confusion matrix. The top left one is logistic Regression fitted using SMOTE technique. The other three are other models fitted with under sampling method. Still, logistic regression is the best.
Neural Networks Testing Random UnderSampling Data vs OverSampling (SMOTE)
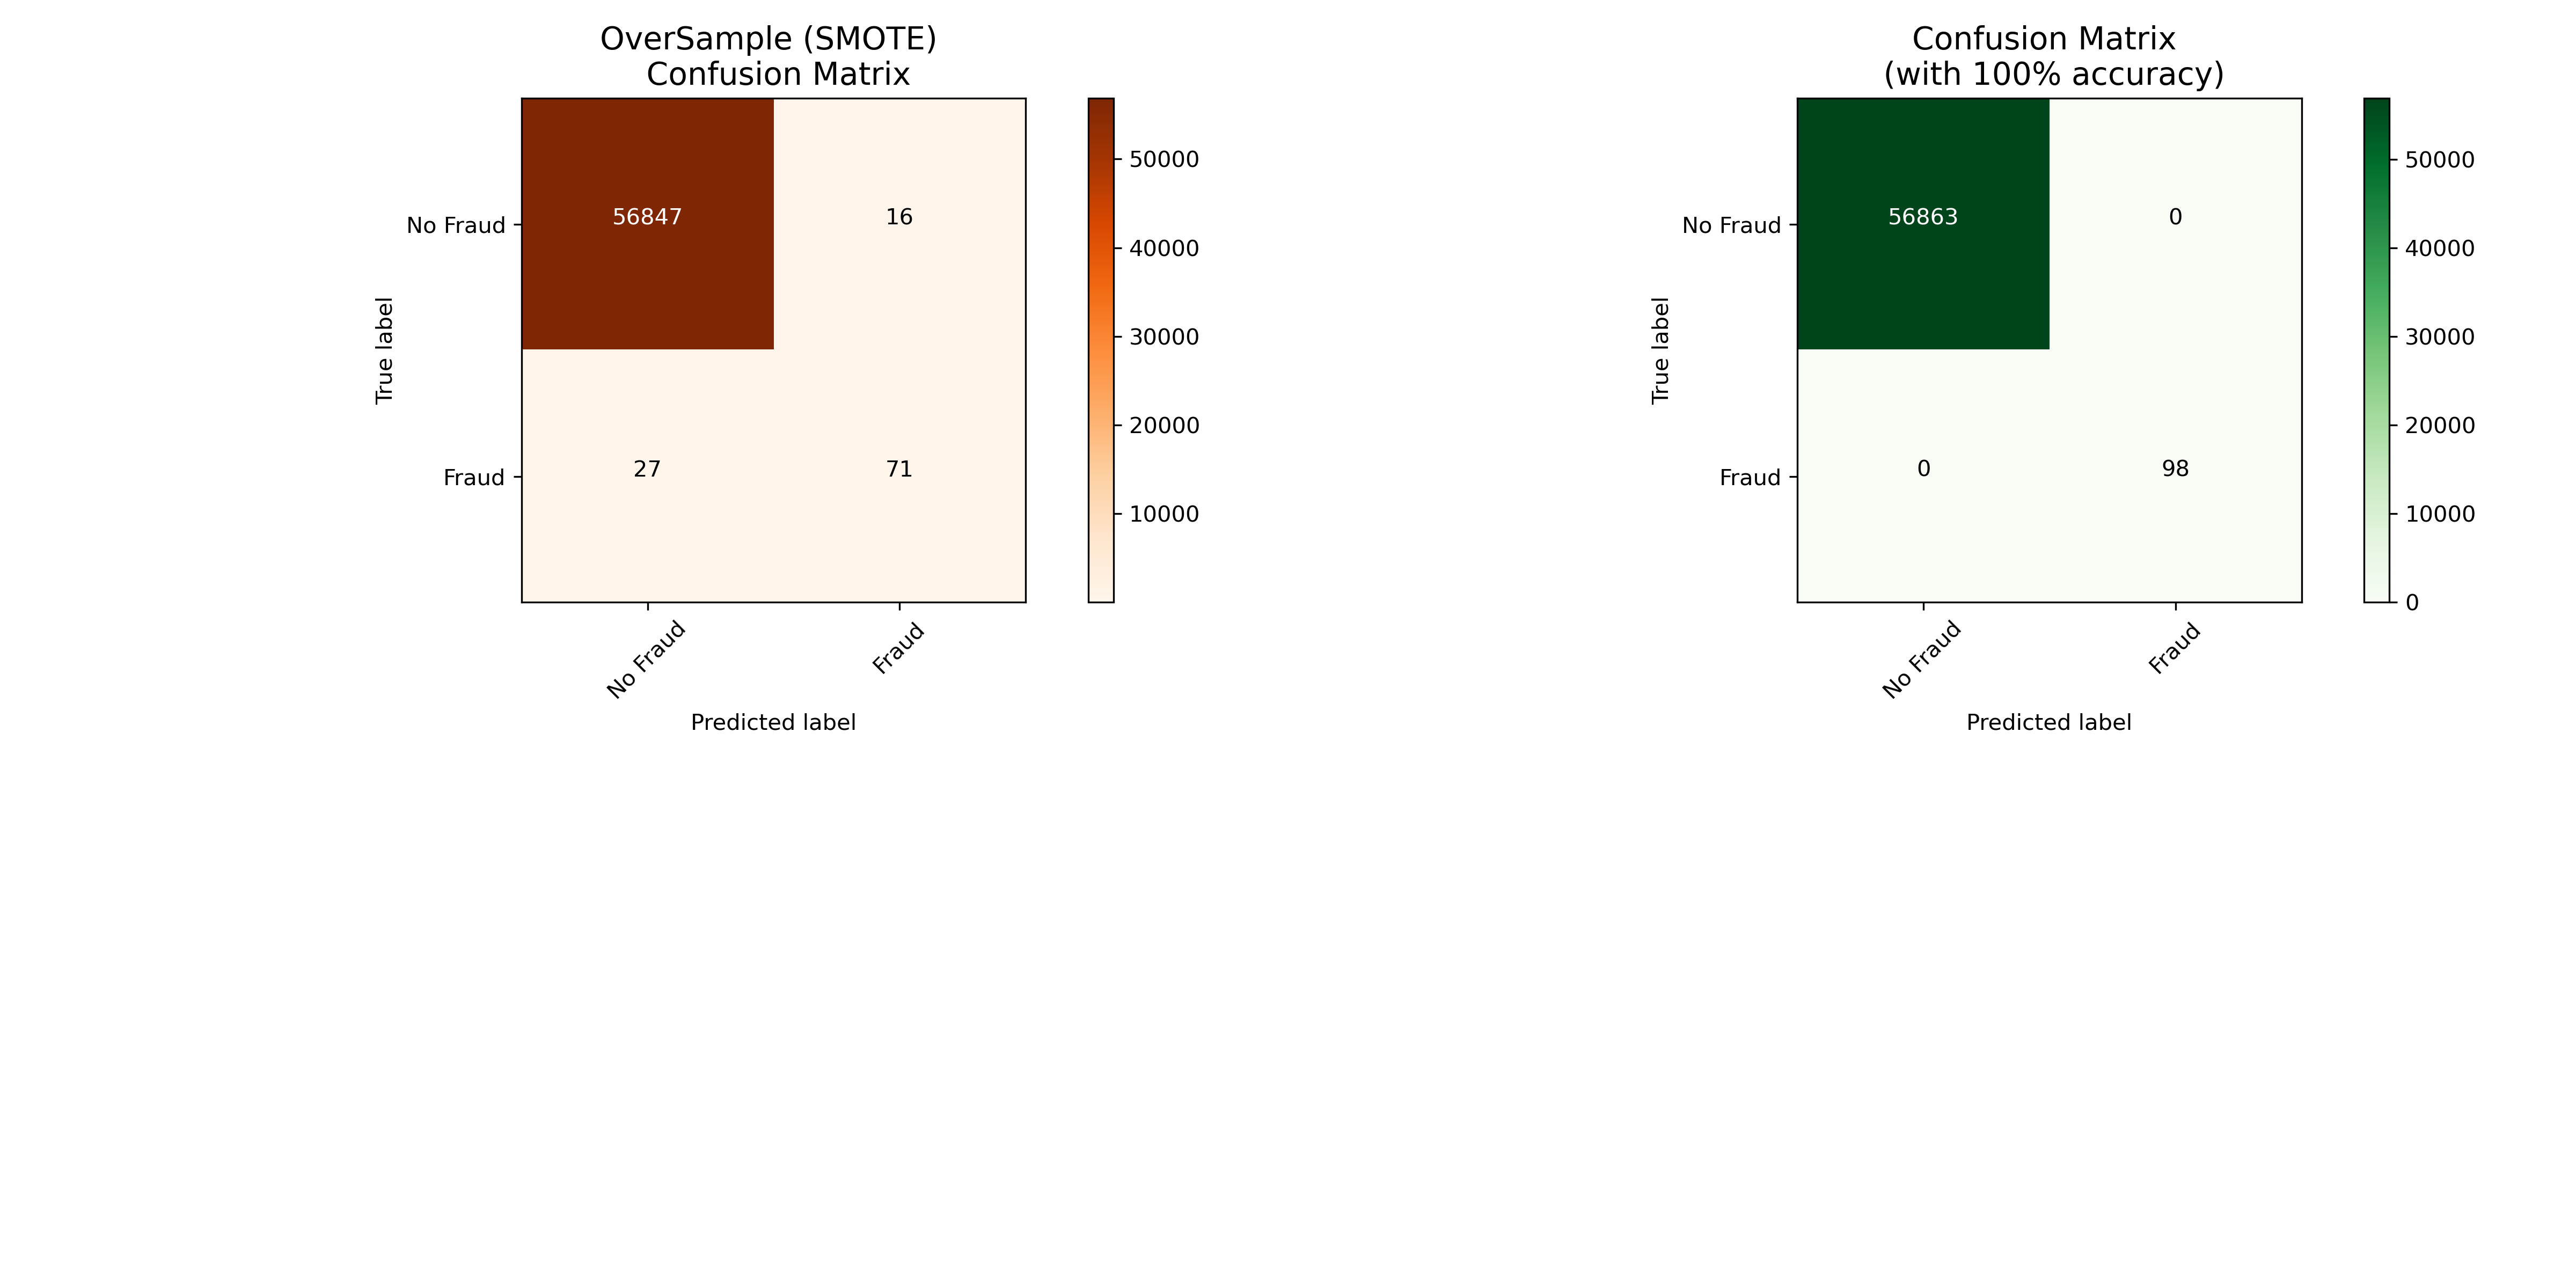
Finally, a simple one hidden layer of Neural Network is used to check which of the two logistic regressions models we implemented in the (undersample or oversample(SMOTE)) has a better accuracy for detecting fraud and non-fraud transactions.
Below is the confusion matrix of a new neural network that are trained with under sampling method tested on original dataset.
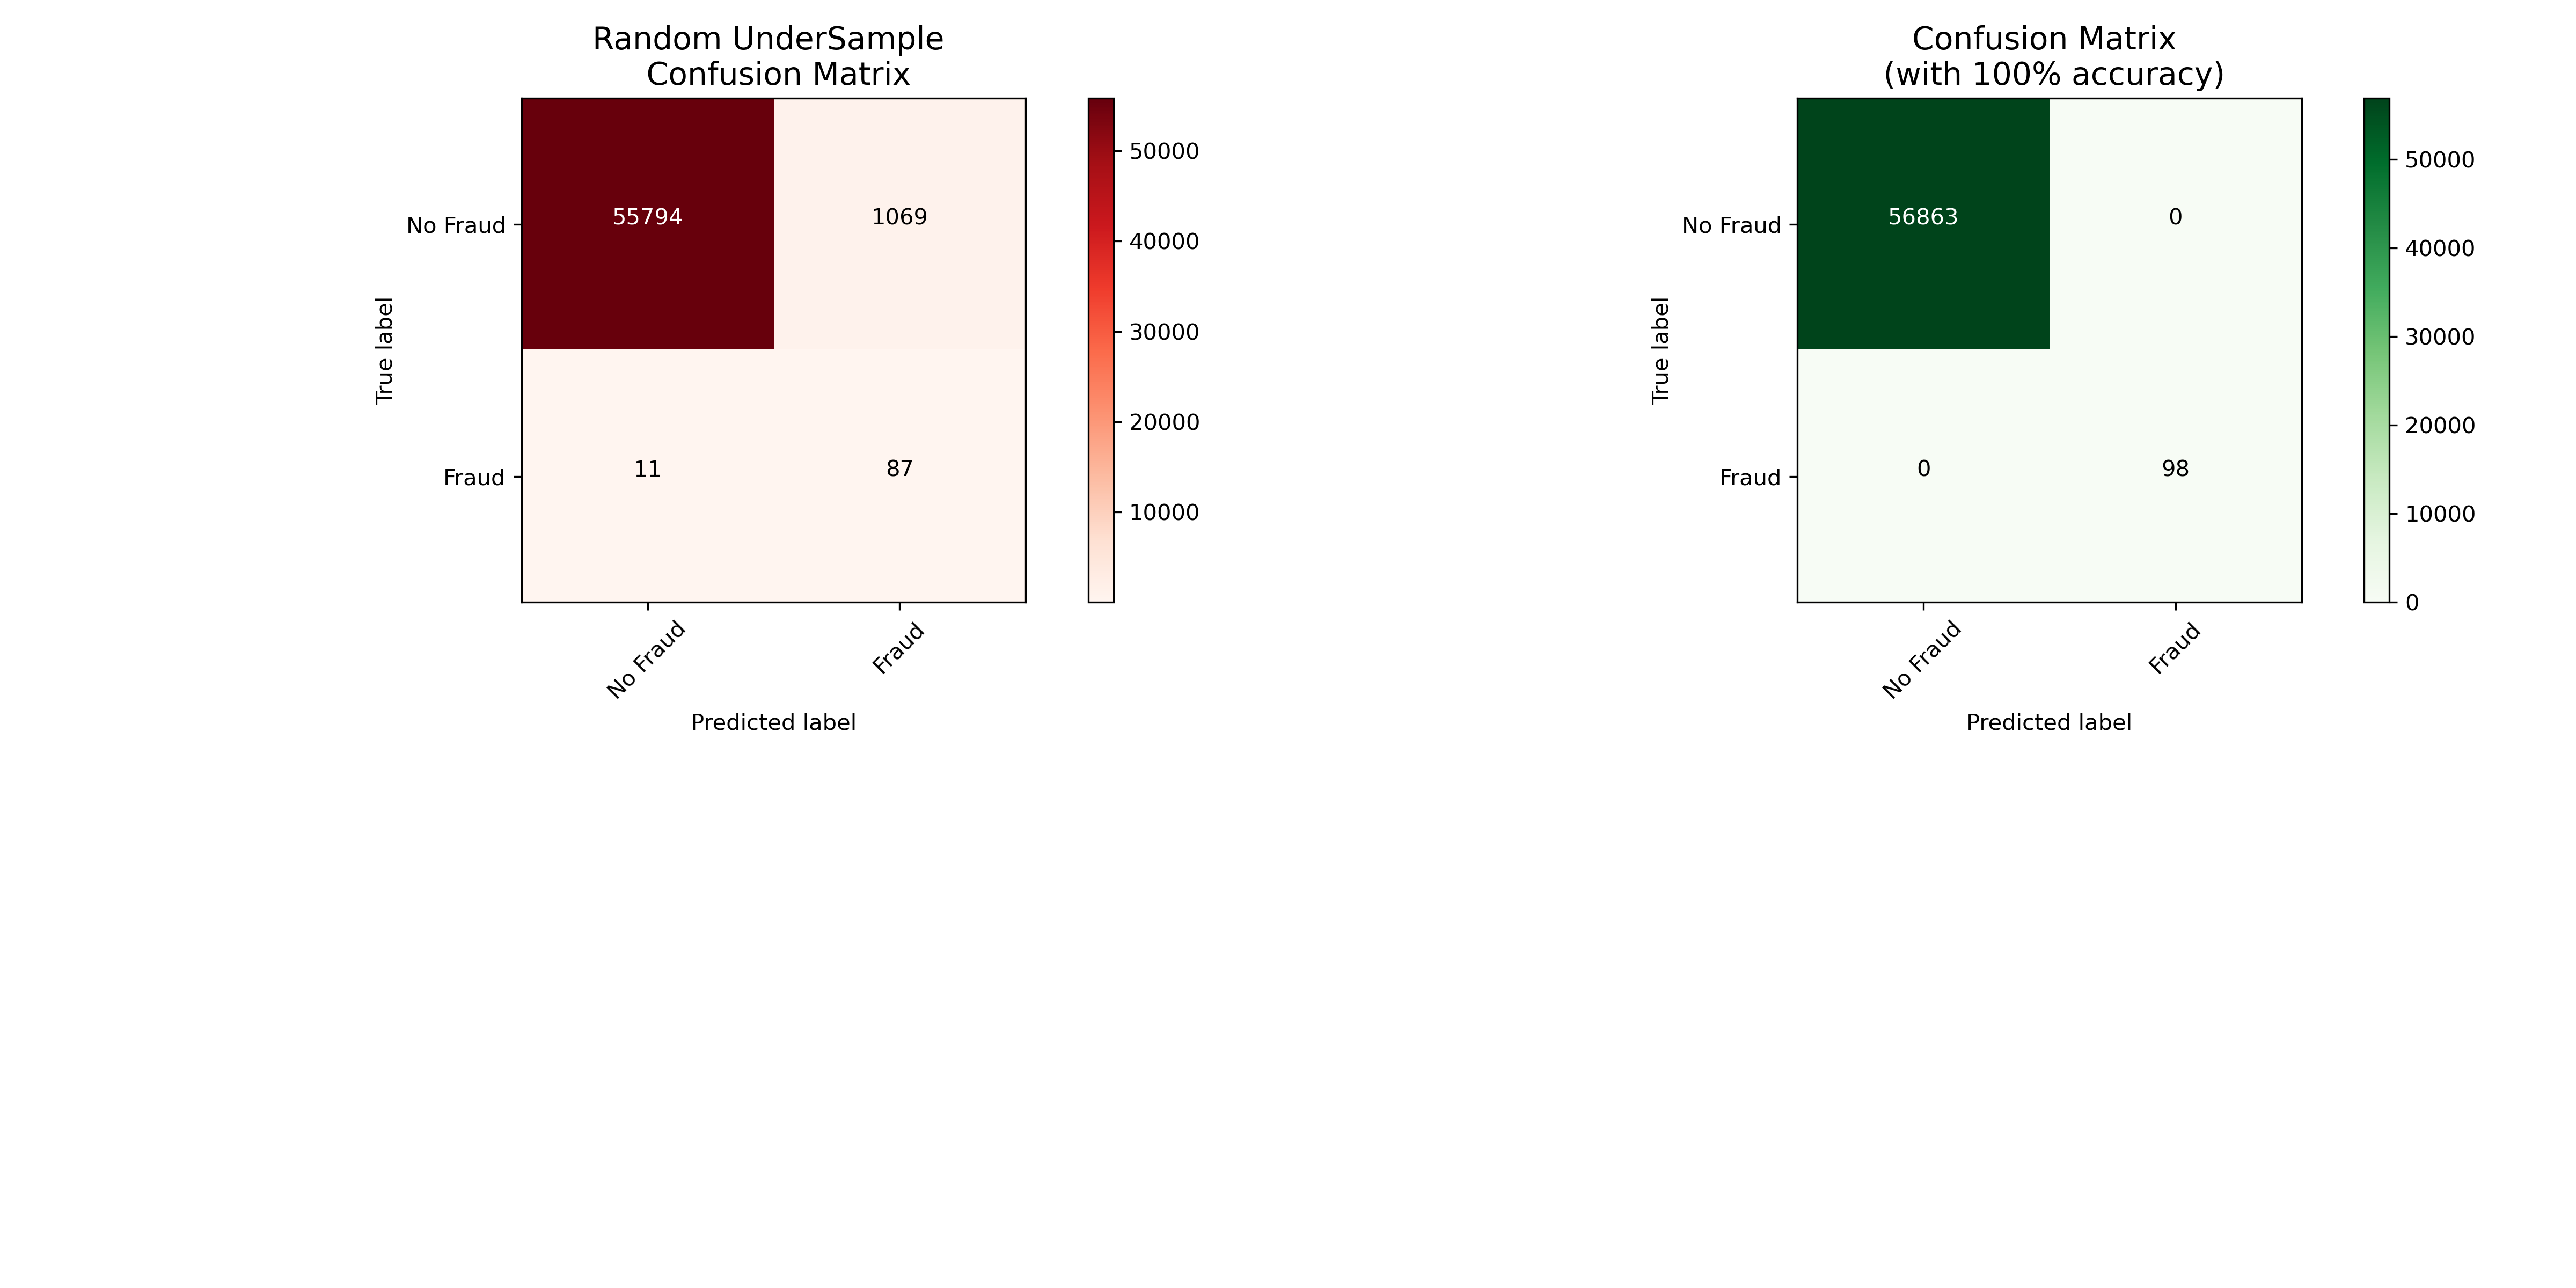
Below is the confusion matrix of a new neural network that are trained with over sampling method tested on original dataset.