COVID-19 County Level Data Analysis
Chenghao Ding, 06 March 2021
COVID-19
A class project to predict COVID-19 affection numbers in county level of US.
Project Description
This project uses county level data about demographics and health-related information to predict one week deaths from April 23rd to April 30th. We consider some predictor variables, such as the polulation, age distribution, gender distribution, per capita share of medical resources and health conditions.
Data Preprocessing
At the county level, our data include COVID-19 cases/deaths from USA Facts and NYT, along with demographic information, health resource availability, COVID-19 health risk factors, and social mobility information. While at the hospital level, our data include the location of the hospital, the number of ICU beds, the total number of employees, and the hospital type.
Missing Value Treatment
First, any feature (column) with missing rate more than 5 percent(totally 17 columns) are directly deleted. After deleting, the highest missing rate for feature is 2.316%. KNN Imputation we use kNN Imputation to fill in the NAs, which uses the values of 10 neighbours and obtains an weighted (by the distance to the case) average of their values to fill in the unknowns. If there is no improvement of NA rate after imputation, then we delete the observations, otherwise, we keep the imputation with KNN.
Feature engineering
We extract the most relevant features (demographic and health-related) from raw data so that these features can be used to improve the performance of learning algorithms. To do this, we perform a principal component analysis on demographic and health-related data. We exclude non-relevant data like county name and other string data and prepare two datasets. Correlation and scale are both set to be true while performing PCA analysis to avoid unfair comparison due to difference of magnitude of each label.
Clustering
At first, to give a simple understanding, we perform the covid-19 growing pattern clustering by k-means method, demographics clustering by spectral method and health-related information clustering by hierarchical clustering method.
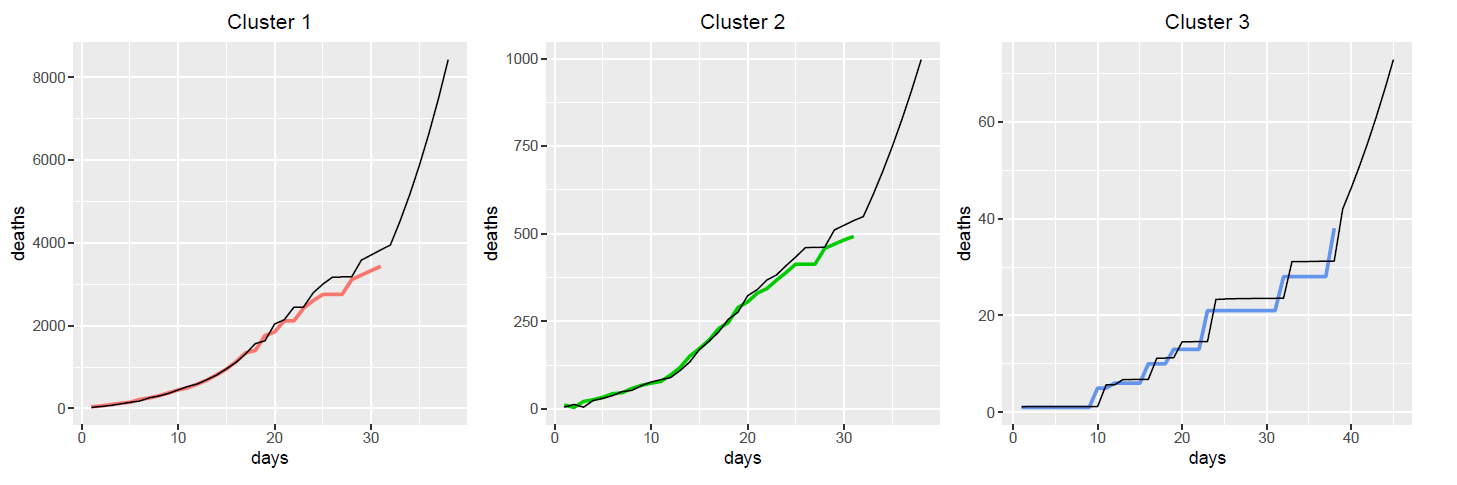
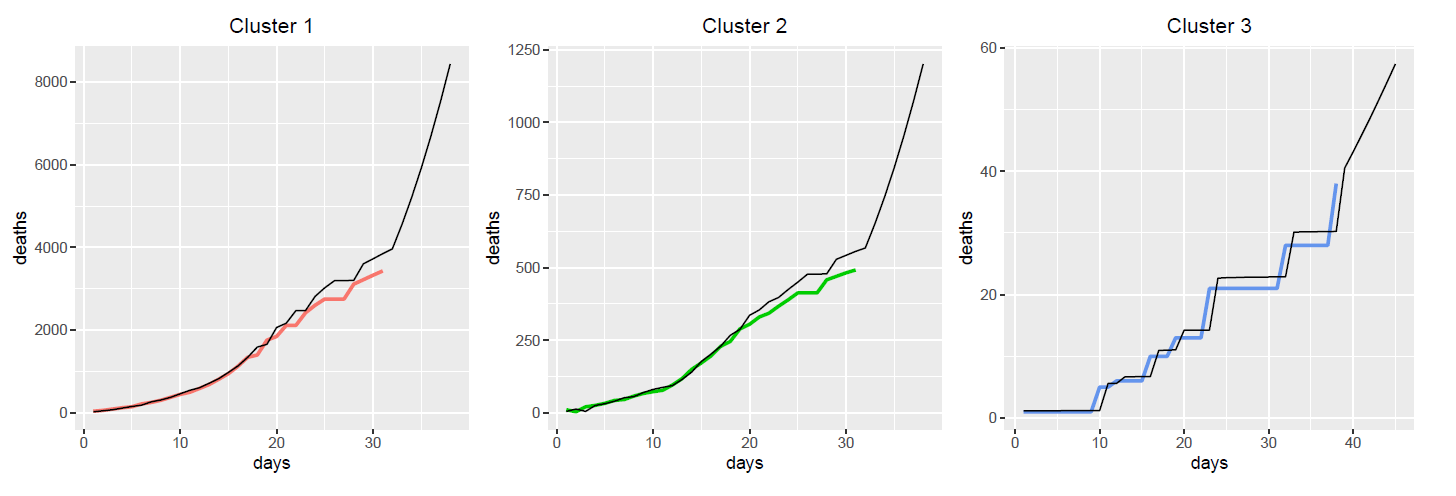
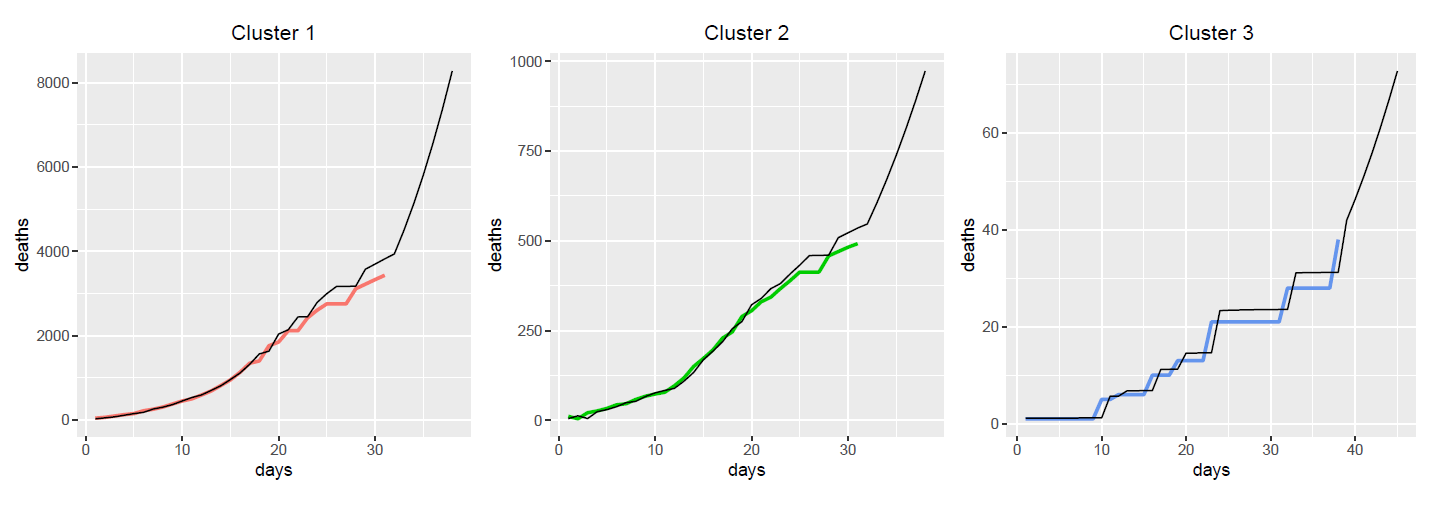
Case Growth rate Pattern: k-means and spectral method
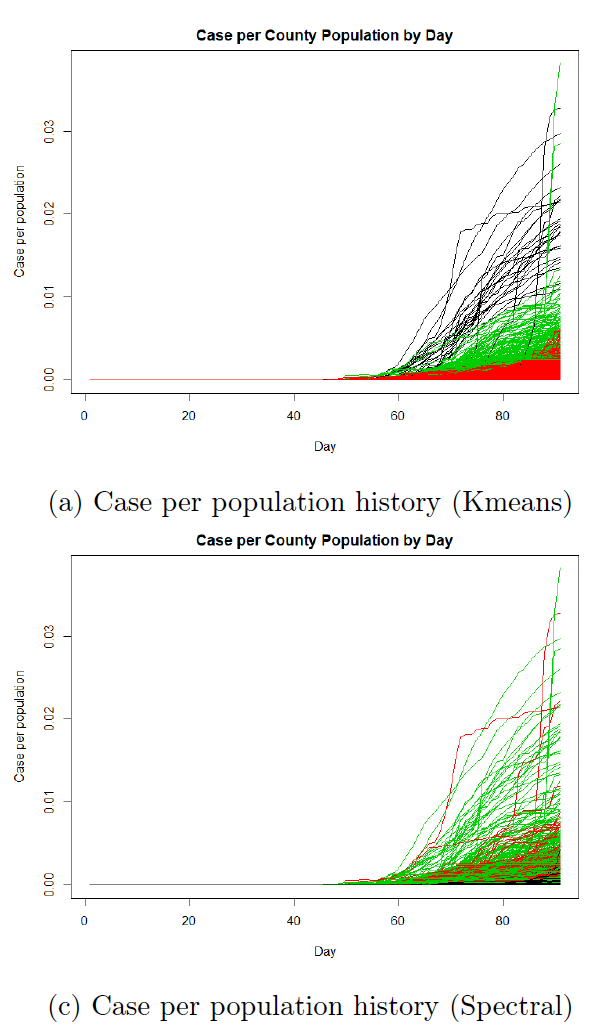
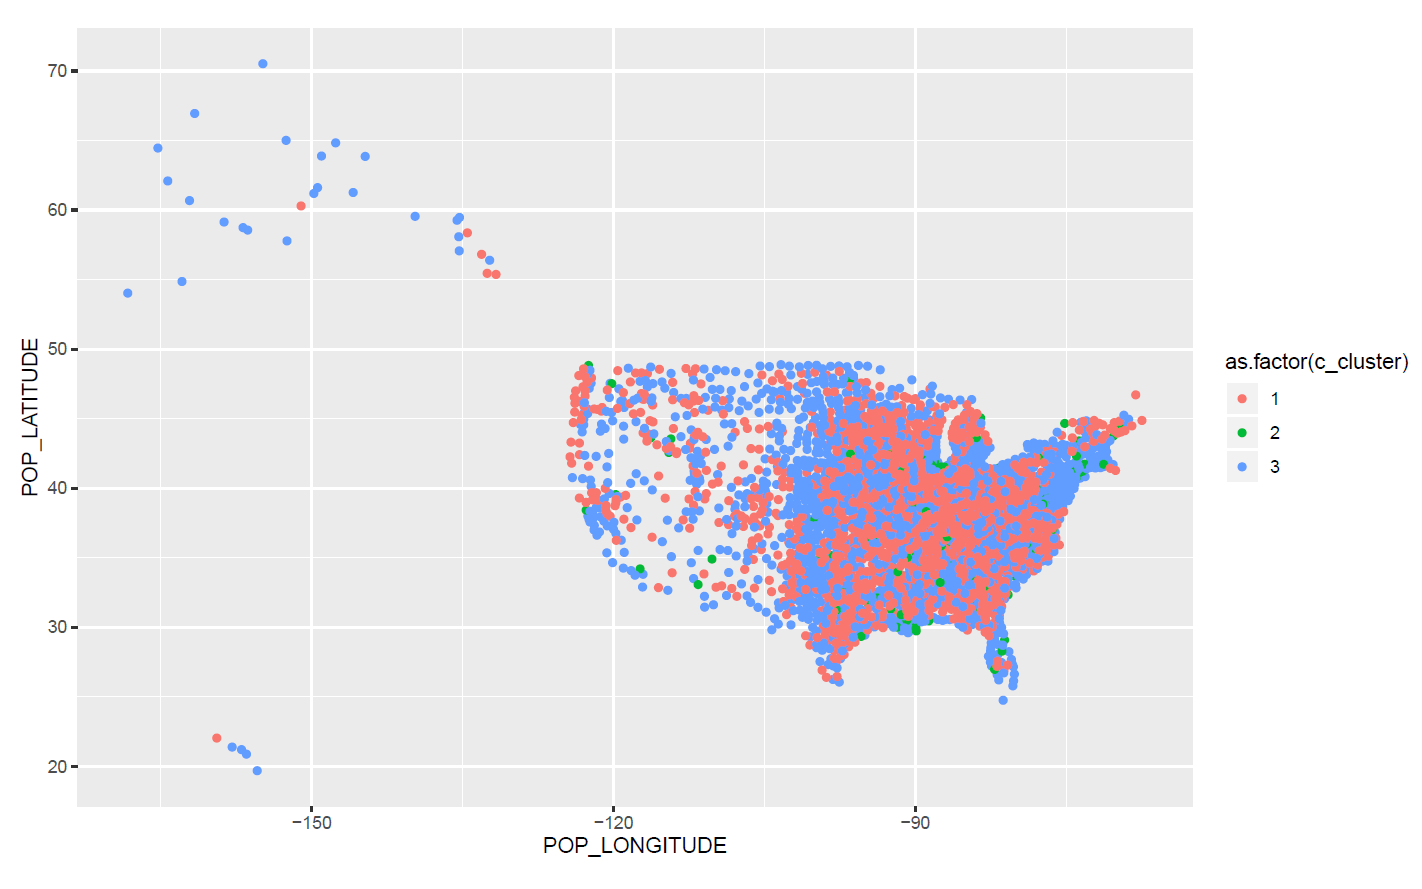
We find cases and health resource are highly affected by the economic situation of a county. Comparing to them, deaths and demographics do not show any obvious regional characteristics and scatter throughout the country. The classification performs well and can give identify most counties with high death rate.
Classification
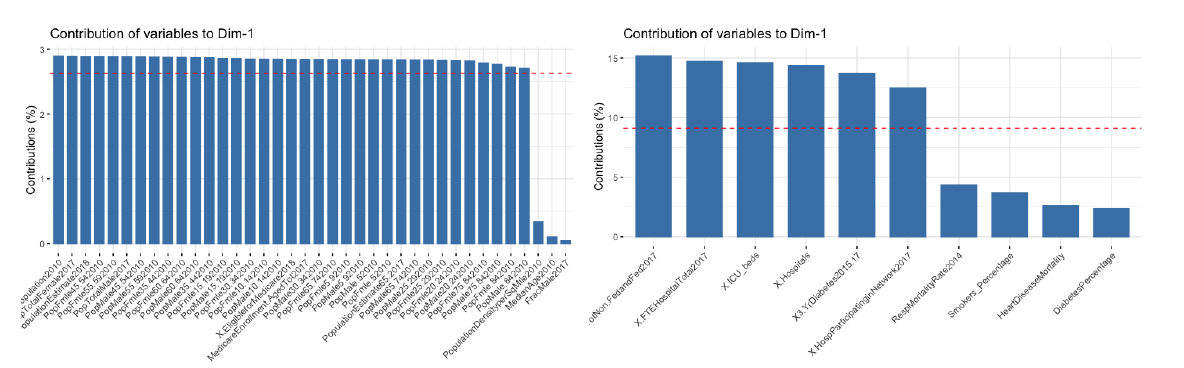
We select our features that will contribute the most to PC1. Figure shows the contribution of each feature to PC1 for both data sets. We discard all the features whose contribution is under the red dashed line.
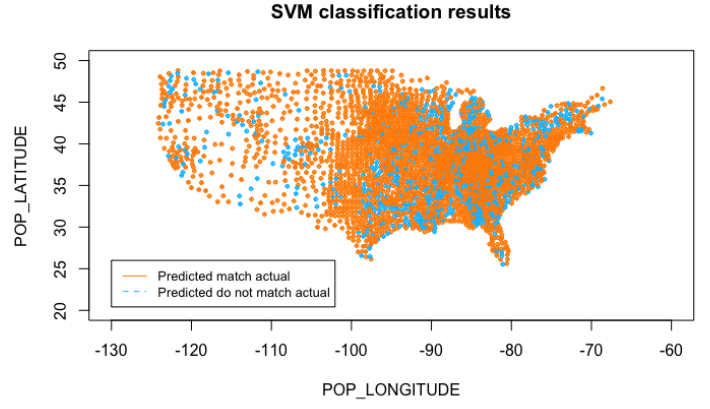
SVM for Binary Classification
First one with death rate more than 1/100000 and the other one with death rate less than 1/100000. We perform a non-linear classification using SVM with the radial kernel.
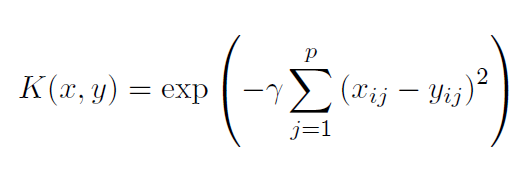
where is a tuning parameter which accounts for the smoothness of the decision boundary and controls the variance of the model. Hence, there are two parameters in SVM function: γ and cost.
A 10 fold cross-validation for a grid of gamma and cost is performed to tune the parameter so that we can get the best performance out of the model. The best performance is found when gamma = 0.003125 and cost = 32 and the accuracy is about 0.77.
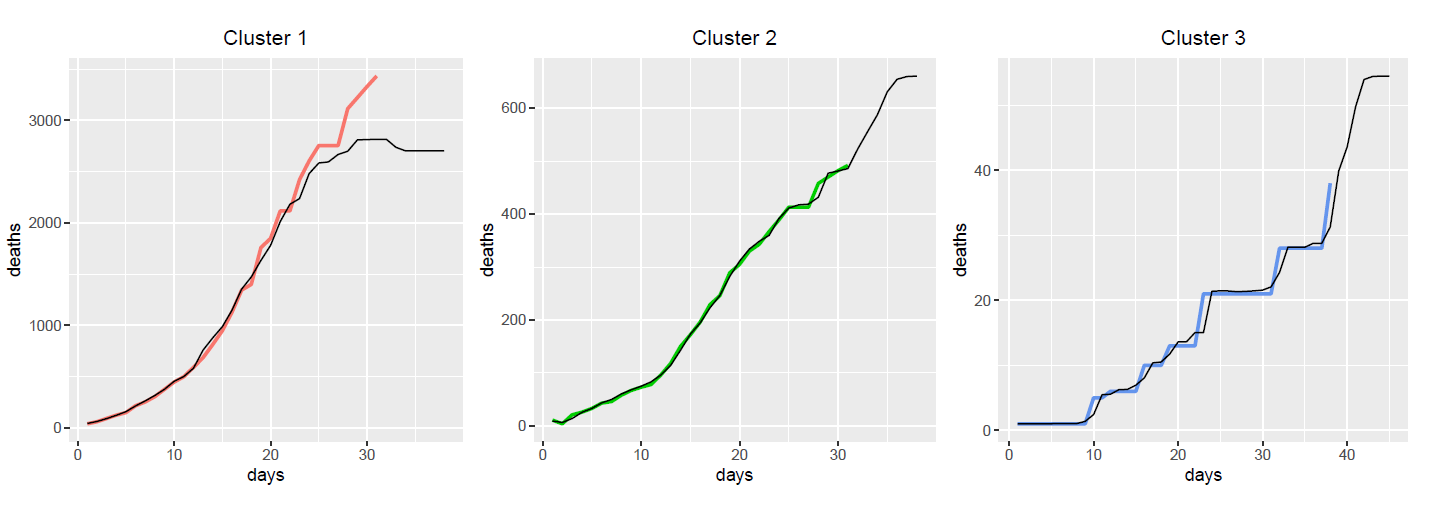
Regression:One Week Death Count Prediction
Four regression methods, elastic penalized regression, random forest regression, GAM regression and XGBoost method, are used to to predict one week deaths, based on the previous days’ amount of deaths, the cases a week ago and the characteristics of demogrphics and health-related information.
The relationship between respond variable (amount of deaths in day t in each county) and predictor variables:
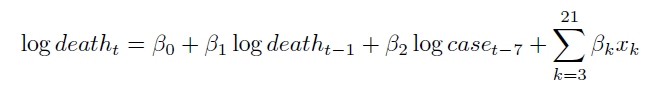
The xk’s are the variables about demographics and health related information at county level introduced in Section “Data Processing”.
Elastic Linear Regression and Stepwise Method
We want to use the simple linear regression(OLS) to build the model, but we prefer less variables. Thus, consider Elastic Penalty (with α = 0.5) to reduce the dimention at first. Elastic penalized method is a method combine the l1 penalty and l2 penalty.
Generalized Additive Model
Boosting model
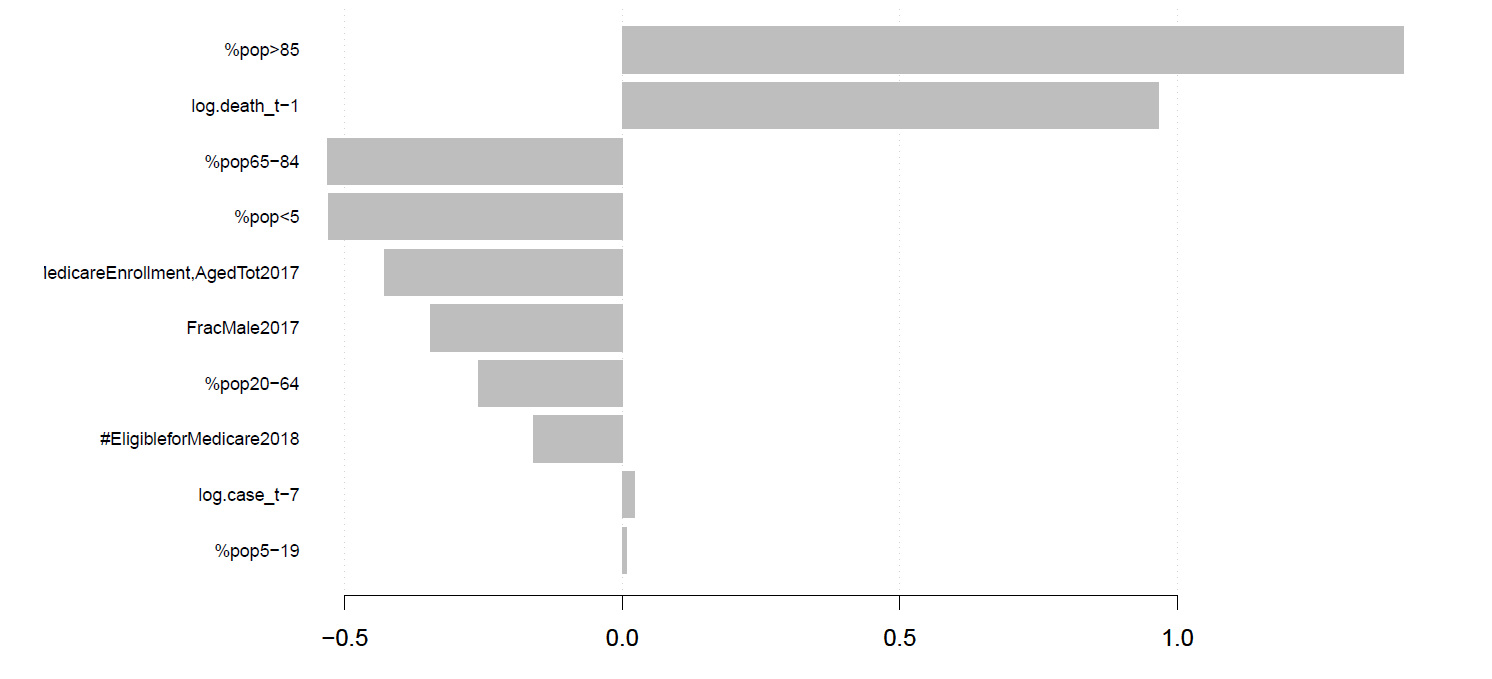
The best tunning paramter of learning rate is 0.2932461, and max_depth is 10. The mean sqaured error of prediction in training dataset will be 0.0354181. The most important factor that are affecting death toll is the proportion of senior people of age older than 85. The second most important factor that are affecting prediction of death toll is the death number one day before in that county. This is supported by the COVID-19 pandemic study of WHO that senior people are more vulnerable to COVID-19 disease.
Random Forest
Conclusion
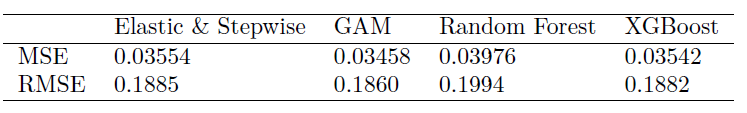
The table below presents the training MSE and RMSE for each method. We see that the Generalized Addictive Model has the smallest MSE among the four methods.
We conclude that the the population and population density makes their death toll rise even faster in the county. People over 85 with heart disease are more vulnerable to this virus. Comparing to male, female are more vulnerable. It is helpful for reducing the deaths to provide adequate medical resource, such as a hospital. However, because of the population base, age density and gender density are related to social situation in this area, we think the analysis of vulnerable poeple are affected.